. 2008 Sep 16;6(9):e226.
doi: 10.1371/journal.pbio.0060226.

SARS-coronavirus replication is supported by a reticulovesicular network of modified endoplasmic reticulum

Affiliations

SARS-coronavirus replication is supported by a reticulovesicular network of modified endoplasmic reticulum

Kèvin Knoops et al. PLoS Biol. .

Abstract

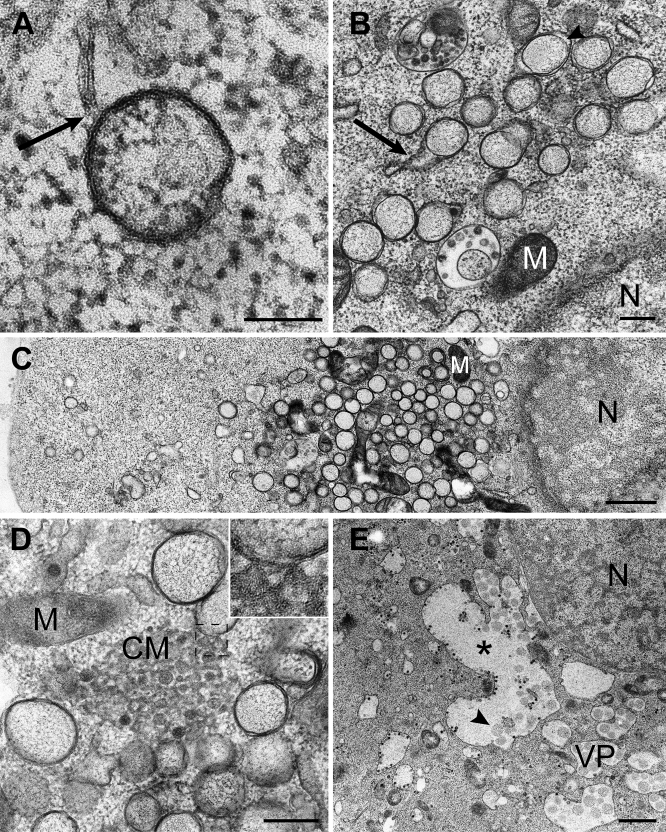
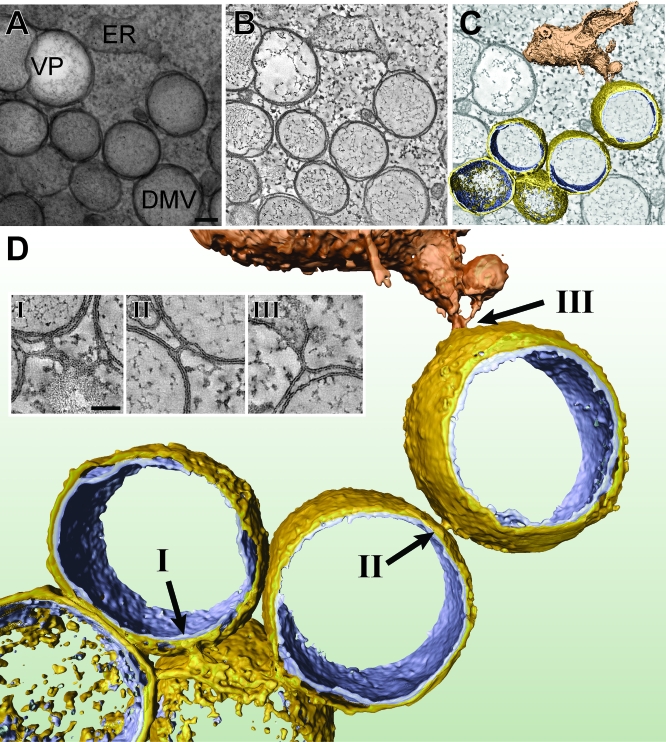
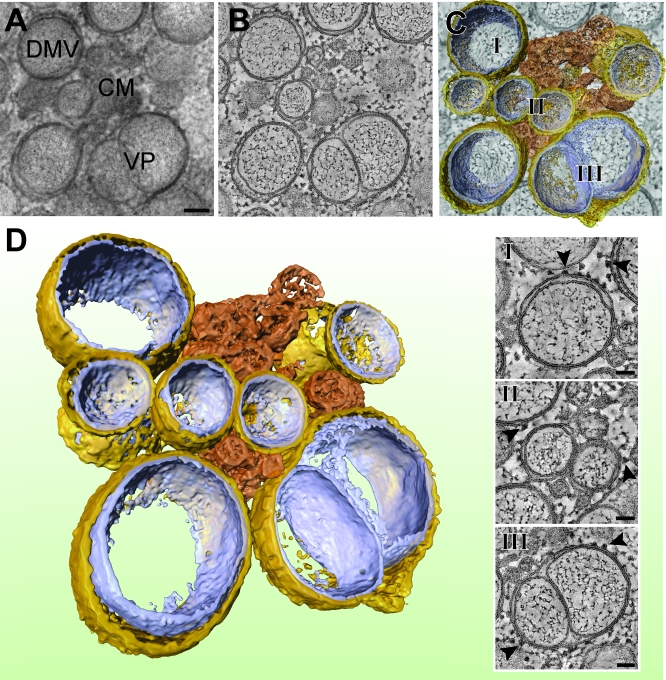
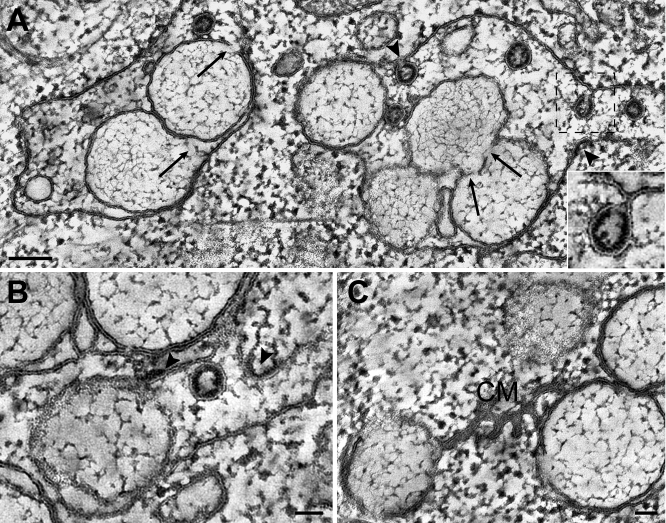
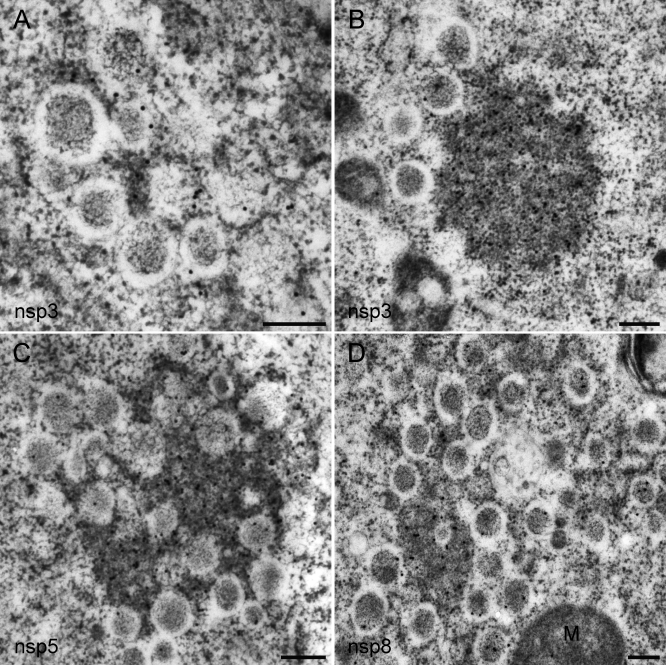
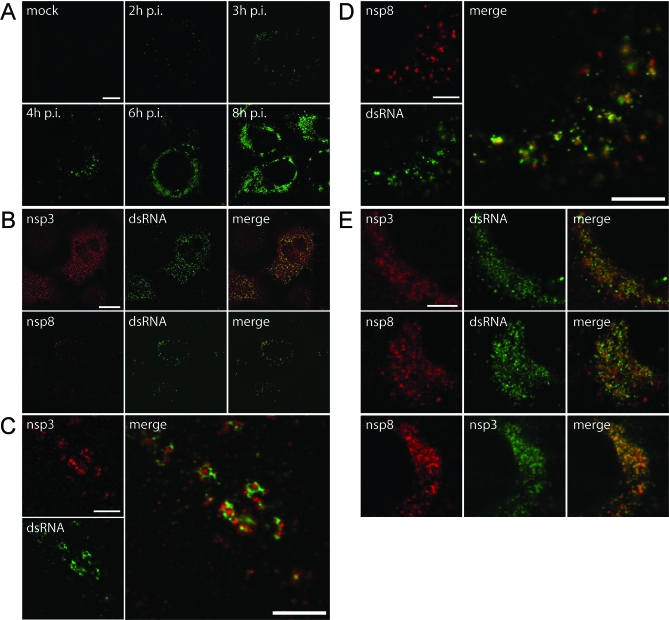
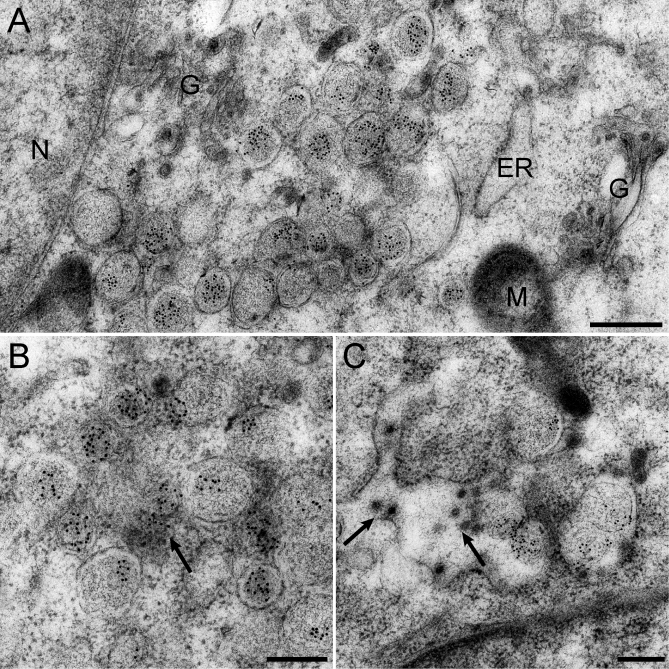
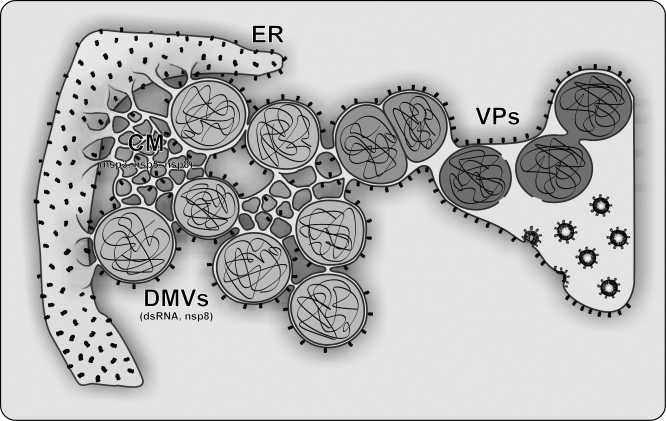
Positive-strand RNA viruses, a large group including human pathogens such as SARS-coronavirus (SARS-CoV), replicate in the cytoplasm of infected host cells. Their replication complexes are commonly associated with modified host cell membranes. Membrane structures supporting viral RNA synthesis range from distinct spherular membrane invaginations to more elaborate webs of packed membranes and vesicles. Generally, their ultrastructure, morphogenesis, and exact role in viral replication remain to be defined. Poorly characterized double-membrane vesicles (DMVs) were previously implicated in SARS-CoV RNA synthesis. We have now applied electron tomography of cryofixed infected cells for the three-dimensional imaging of coronavirus-induced membrane alterations at high resolution. Our analysis defines a unique reticulovesicular network of modified endoplasmic reticulum that integrates convoluted membranes, numerous interconnected DMVs (diameter 200-300 nm), and "vesicle packets" apparently arising from DMV merger. The convoluted membranes were most abundantly immunolabeled for viral replicase subunits. However, double-stranded RNA, presumably revealing the site of viral RNA synthesis, mainly localized to the DMV interior. Since we could not discern a connection between DMV interior and cytosol, our analysis raises several questions about the mechanism of DMV formation and the actual site of SARS-CoV RNA synthesis. Our data document the extensive virus-induced reorganization of host cell membranes into a network that is used to organize viral replication and possibly hide replicating RNA from antiviral defense mechanisms. Together with biochemical studies of the viral enzyme complex, our ultrastructural description of this "replication network" will aid to further dissect the early stages of the coronavirus life cycle and its virus-host interactions.


Conflict of interest statement

Competing interests. The authors have declared that no competing interests exist.

Figures

Figure 1
Figure 1. The Coronavirus Replicase Polyprotein
The domain organization and proteolytic processing map of the SARS-CoV replicase polyprotein pp1ab. The replicase cleavage products (nsp1–16) are numbered, and conserved domains are highlighted (blue, conserved across nidoviruses; grey, conserved in coronaviruses). These include transmembrane domains (TM), protease domains (PLP and MP), and (putative) RNA primase (P), helicase (HEL), exonuclease (Exo), endoribonuclease (N), and methyl transferase (MT) activities. For more details, see [14,18]. The delineation of amino acids encoded in ORF1a and ORF1b is indicated as RFS (ribosomal frameshift), and arrows represent sites in pp1ab that are cleaved by the nsp3 papain-like protease (in blue) or the nsp5 main protease (in red).
Figure 2
Figure 2. Overview of Membrane Structures Induced by SARS-CoV Infection
Electron micrographs of SARS-CoV–infected Vero E6 cells. The cells were cryofixed and freeze substituted at 2 h p.i. (A), 8 h p.i. (B–D), or 10 h p.i. (E). (A) Early DMV as observed in a few sections, showing a connection (arrow) to a reticular membrane. (B) From 4 h p.i. on, clusters of DMVs began to form. Occasionally, connections between DMV outer membranes and reticular membrane structures were observed (arrow). Locally, luminal spacing between the DMV outer and inner membranes could be discerned (arrowhead). (C) As infection progressed, DMVs were concentrated in the perinuclear area (nucleus; N), often with mitochondria (M) lying in between. (D) Example of a cluster of CM, which were often surrounded by groups of DMVs. The structure seems to be continuous with the DMV outer membrane (inset). (E) During the later stages of infection, DMVs appeared to merge into VPs, which developed into large cytoplasmic vacuoles (asterisk) that contained not only single-membrane vesicles (arrowhead pointing to an example), but also (budding) virus particles. Scale bars represent 100 nm (A), 250 nm (B and D), or 1 μm (C and E).
Figure 3
Figure 3. Electron Tomography Revealing the Interconnected Nature of SARS-CoV–Induced DMVs
The series of images at the top illustrates how a 3-D surface-rendered model was derived by applying ET on a semi-thick section of a SARS-CoV–infected Vero E6 cell cryofixed at 7 h p.i. (A) A 0°-tilt transmission EM image of a 200-nm-thick resin-embedded section showing ER and a cluster of DMVs. The 10-nm gold particles were layered on top of the sections and were used as fiducial markers during subsequent image alignment. Scale bar represents 100 nm. (B) Using the IMOD software package (see Materials and Methods), tomograms were computed from dual-axis tilt series of the 200-nm-thick section shown in (A) (see also Videos S1 and S2). The tomographic slice shown here has a thickness of 1.2 nm. (C) The improved image from (B) following anisotropic diffusion filtering. The optimized signal-to-noise ratio facilitates thresholding and DMV surface rendering. See Figure S2 for a stereo image of this model. (D) Final 3-D surface-rendered model showing interconnected DMVs (outer membrane, gold; inner membrane, silver) and their connection to an ER stack (depicted in bronze). Arrows (I, II, and III) point to three clearly visible outer membrane continuities, with insets highlighting these connections in corresponding tomographic slices. Scale bar represents 50 nm.
Figure 4
Figure 4. Electron Tomography of SARS-CoV–Induced CM, DMVs, and VPs
As in Figure 3, (A–C) illustrate how a 3-D surface-rendered model was derived by applying ET on a semi-thick section of a SARS-CoV–infected Vero E6 cell cryofixed at 7 h p.i. Scale bar in (A) represents 100 nm. The type 1 VP present in this image shows an outer membrane that accommodates two tightly apposed inner vesicles with minimal luminal spacing. The insets (I, II, and III) below (C) show tomographic slices that highlight the presence of ribosomes (arrowheads) on DMV and VP outer membranes. Scale bar represents 50 nm. (D) shows the final 3-D surface-rendered model of this cluster of larger and smaller DMVs (outer membrane, gold; inner membrane, silver) of which the outer membranes are connected to the type 1 VP and a CM structure (depicted in bronze). See Figure S2 for a stereo image of this model.
Figure 5
Figure 5. Electron Tomography of the SARS-CoV–Induced Reticulovesicular Membrane Network at a More Advanced Stage of Development
Gallery of 10-nm-thick digital slices of tomograms (see legend to Figure 3B) from SARS-CoV–infected Vero E6 cells again cryofixed at 7 h p.i., but now selected for cells in which infection had progressed more than in others, allowing the visualization of more advanced stages of development of the virus-induced membrane alterations. (A) VP of the second type, showing a more relaxed outer membrane and several discontinuities (arrows) of inner vesicle membranes. New SARS-CoV particles can be seen budding from a VP outer membrane into the luminal space (arrowheads and inset; the inset shows a slightly tilted image to optimize the view). (B) Initial stage of virus budding from a VP outer membrane: formation of the electron-dense nucleocapsid structure at the cytosolic side of the membrane (arrowheads). (C) Example of a CM structure showing stacked membranes that are continuous with DMV outer membranes. Scale bars represent 100 nm (A) or 50 nm (B and C).
Figure 6
Figure 6. Immunogold EM of the SARS-CoV Replicase in Infected Cells
SARS-CoV–infected Vero E6 cells were cryofixed at 8 h p.i. and processed for FS and IEM using rabbit antisera (see Materials and Methods). In all images, 15-nm colloidal gold particles conjugated to protein A were used for detection of primary antibodies. (A and B) Labeling for SARS-CoV nsp3 was mainly found on the electron-dense areas between DMVs, presumably representing CM as most clearly visible in (B). (C) Immunolabeling for SARS-CoV nsp5 (the viral main protease), which was essentially similar to that for nsp3. (D) When using an antiserum recognizing SARS-CoV nsp8 (the putative viral primase), the majority of label was again present on CM. However, a small fraction of the nsp8 signal was reproducibly found on the interior of DMVs. Scale bars represent 250 nm.
Figure 7
Figure 7. Detection of dsRNA in SARS-CoV–Infected Cells
SARS-CoV–infected Vero E6 cells were fixed at various time points after infection and processed for IF assays using rabbit antisera recognizing different replicase subunits and a mouse monoclonal antibody specific for dsRNA. Imaging was done using a confocal laser scanning microscope. (A) Time-course experiment showing the development of dsRNA signal, which could be detected as early as 2 h p.i. Later in infection, the initially punctate cytoplasmic staining developed into a number of densely labeled areas close to the nucleus. (B) Dual-labeling IF assays using antisera recognizing dsRNA and either nsp3 or nsp8. The early signals for dsRNA and both nsps (here shown at 3 h p.i.) were found in close proximity of each other and partially overlapped. (C) High-resolution images of dual-labeling experiments for nsp3 and dsRNA early in infection (4 h p.i.), with the enlarged merged image illustrating that these signals were largely separated. (D) See (C), but now a dual-labeling experiment for nsp8 and dsRNA was performed. (E) High-resolution images of dual-labeling experiments for nsp3, nsp8, and dsRNA later in infection (6 h p.i.). Whereas the two nsps colocalized to a large extent (bottom row), this was less obvious when the labeling for dsRNA and replicase subunits was compared. Scale bars represent 10 μm (A), 25 μm (B), or 5 μm (C–E).
Figure 8
Figure 8. Immunogold EM Reveals Abundant dsRNA Labeling on the Interior of SARS-CoV–Induced DMVs
SARS-CoV–infected Vero E6 cells were high-pressure frozen and processed for FS and IEM using a monoclonal antibody specific for dsRNA. In all images, 10-nm gold particles conjugated to protein A were used for detection of primary antibodies. (A) Overview of a SARS-CoV–infected cell at 7 h p.i., documenting the specificity of the dsRNA labeling and the abundant amount of label present on DMVs. G, Golgi complex; N, nucleus; M, mitochondria. (B) Cluster of abundantly labeled DMVs with additional labeling present in the area between the vesicles (arrow). (C) Type 2 VP showing abundant labeling for dsRNA on the interior of the inner vesicles. In addition, newly assembled virus particles can be seen in the lumen of the compartment (arrows). Scale bars represent 500 nm (A) or 250 nm (B and C).
Figure 9
Figure 9. Electron Tomography-Based Model of the Network of Modified ER Membranes That Supports SARS-CoV RNA Synthesis
A model showing the SARS-CoV–induced reticulovesicular network of modified membranes with which both viral replicase subunits and dsRNA are associated. Time postinfection increases from left to right. The various interconnected membrane structures documented in this study are depicted. The CM, the outer membranes of DMVs and VPs, and—ultimately—membrane compartments used for virus budding were all found to be continuous with the rough ER, as underlined by the presence of ribosomes on each of these components. DMV inner membranes and the interior of the vesicles, which contained as yet undefined “fibrous material,” were devoid of ribosomes but labeled abundantly for dsRNA. Ultimately, the network appears to connect membrane structures involved in SARS-CoV RNA synthesis to sites at which the assembly of new virions occurs and may thus contribute to the organization of successive stages in the viral life cycle in both time and space.

Similar articles

Cited by

References

    1. Bienz K, Egger D, Pfister T, Troxler M. Structural and functional characterization of the poliovirus replication complex. J Virol. 1992;66:2740–2747. - PMC - PubMed
    1. Ahlquist P. Parallels among positive-strand RNA viruses, reverse-transcribing viruses and double-stranded RNA viruses. Nat Rev Microbiol. 2006;4:371–382. - PMC - PubMed
    1. Mackenzie J. Wrapping things up about virus RNA replication. Traffic. 2005;6:967–977. - PMC - PubMed
    1. Novoa RR, Calderita G, Arranz R, Fontana J, Granzow H, Risco C. Virus factories: associations of cell organelles for viral replication and morphogenesis. Biol Cell. 2005;97:147–172. - PMC - PubMed
    1. Netherton C, Moffat K, Brooks E, Wileman T. A guide to viral inclusions, membrane rearrangements, factories, and viroplasm produced during virus replication. Adv Virus Res. 2007;70:101–182. - PMC - PubMed

Publication types

MeSH terms