. 2008 Sep 18:7:72.
doi: 10.1186/1476-4598-7-72.

Metabolite profiling of human colon carcinoma--deregulation of TCA cycle and amino acid turnover

Affiliations

Metabolite profiling of human colon carcinoma--deregulation of TCA cycle and amino acid turnover

Carsten Denkert et al. Mol Cancer. .

Abstract

Background: Apart from genetic alterations, development and progression of colorectal cancer has been linked to influences from nutritional intake, hyperalimentation, and cellular metabolic changes that may be the basis for new diagnostic and therapeutic approaches. However, in contrast to genomics and proteomics, comprehensive metabolomic investigations of alterations in malignant tumors have rarely been conducted.

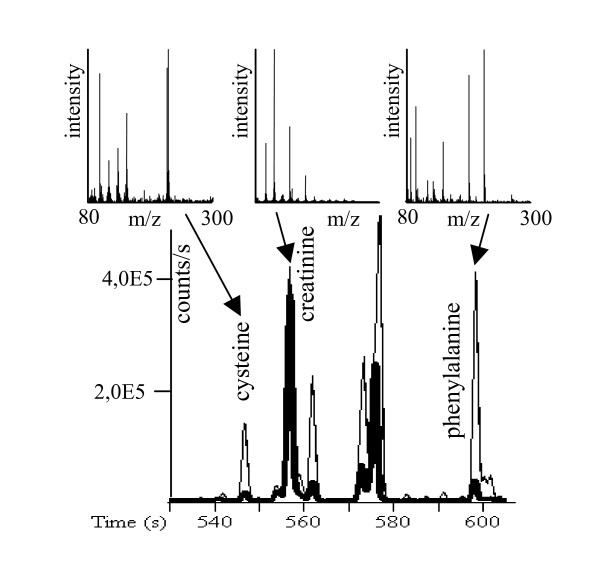
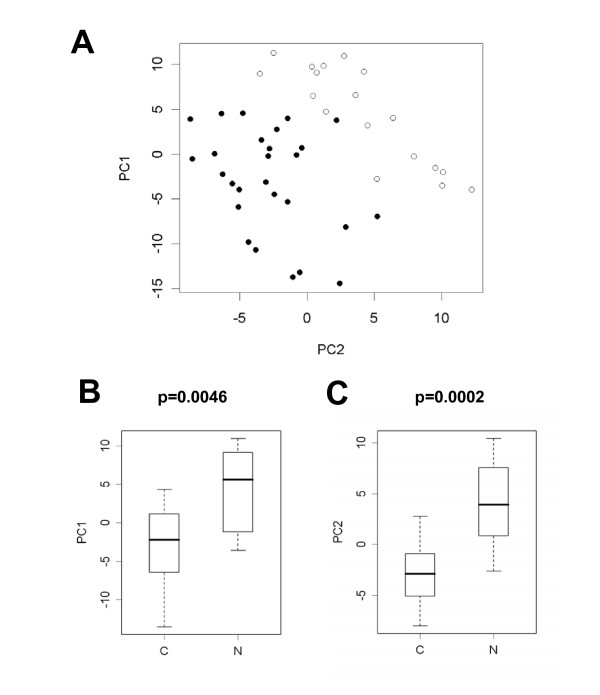
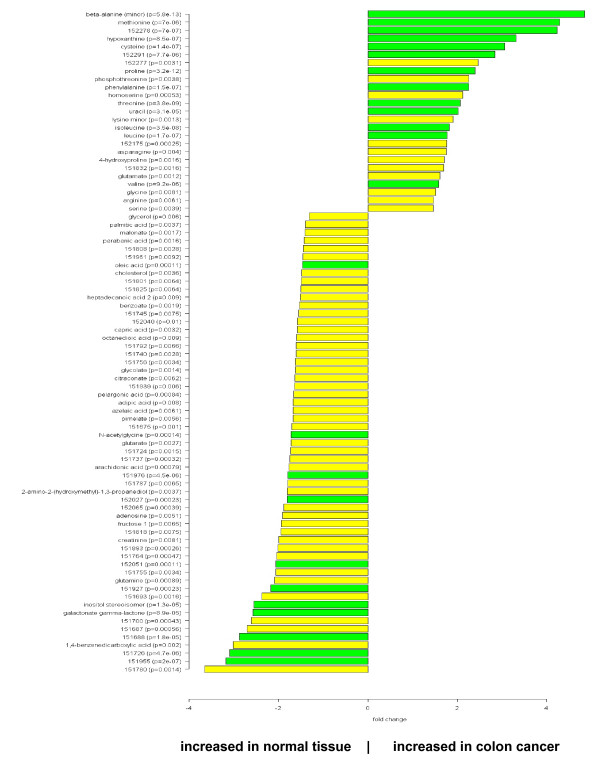
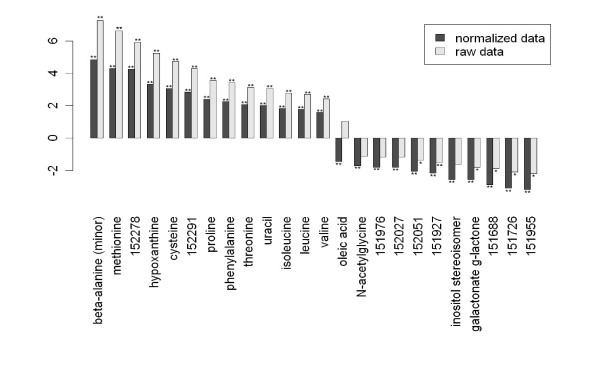
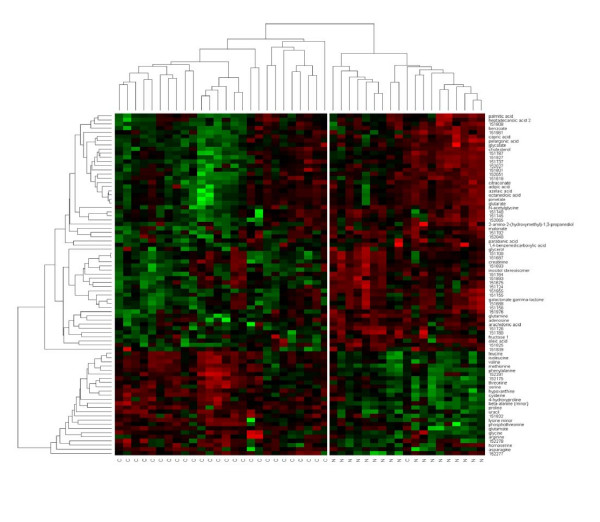
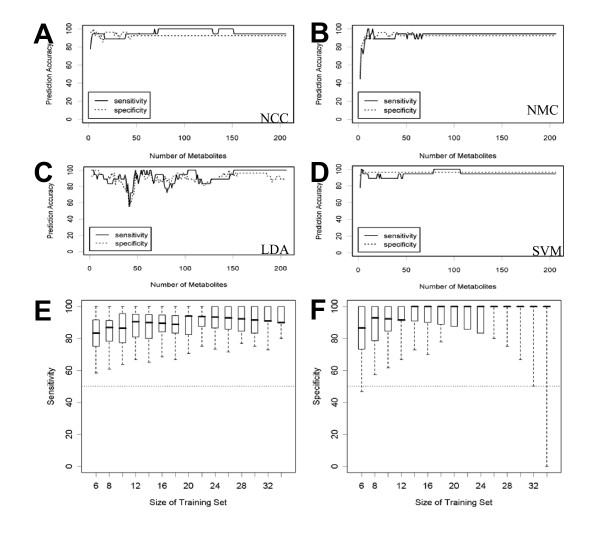
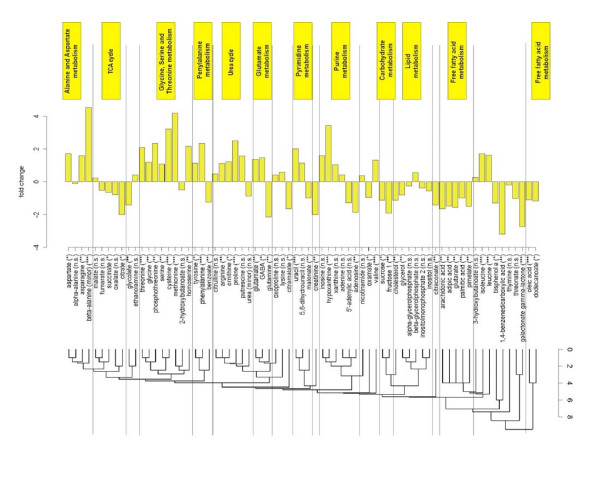
Results: In this study we investigated a set of paired samples of normal colon tissue and colorectal cancer tissue with gas-chromatography time-of-flight mass-spectrometry, which resulted in robust detection of a total of 206 metabolites. Metabolic phenotypes of colon cancer and normal tissues were different at a Bonferroni corrected significance level of p=0.00170 and p=0.00005 for the first two components of an unsupervised PCA analysis. Subsequent supervised analysis found 82 metabolites to be significantly different at p<0.01. Metabolites were connected to abnormalities in metabolic pathways by a new approach that calculates the distance of each pair of metabolites in the KEGG database interaction lattice. Intermediates of the TCA cycle and lipids were found down-regulated in cancer, whereas urea cycle metabolites, purines, pyrimidines and amino acids were generally found at higher levels compared to normal colon mucosa.

Conclusion: This study demonstrates that metabolic profiling facilitates biochemical phenotyping of normal and neoplastic colon tissue at high significance levels and points to GC-TOF-based metabolomics as a new method for molecular pathology investigations.


Figures

Figure 1
Figure 1
Representative GC-TOF chromatograms of paired colon carcinoma (thin line) and normal tissue (bold line) at extracted ions m/z 218+100 between 530–610 s. Select mass spectra (m/z 80–300) are given for the significantly different metabolites cysteine and phenylalanine, and the non-altered compound creatinine.
Figure 2
Figure 2
Principal component analysis (PCA) of colon cancer (dots) and normal colon tissues (circles). A linear combination of the first and the second principal component leads to a nearly perfect separation of carcinomas from normal tissues (A). A single misassigment is found: one tumor clusters within the normal tissue group. Box plots show the separation of cancer and normal tissues by the first and the second principal component (B, C). P-values shown are from Welch's t-test after Bonferroni correction for multiple testing. The boundaries of boxes and whiskers mark the 5th, 25th, 50th, 75th, and 95th percentile.
Figure 3
Figure 3
Comparison of colon cancer versus normal tissue. Fold change pattern of 82 significantly (p < 0.01) regulated metabolites. p-values are given for each metabolite. Dark columns: metabolites that are highly significantly different even after Bonferroni correction (p < 0.00024).
Figure 4
Figure 4
Evaluation of the influence of normalization. Raw (unnormalized) data was used for comparison of differential metabolites between normal colon and colon carcinoma. Of the 24 highly significant metabolites 14 (58%) could be confirmed at the high (p < 0.00024, **) and 19 (79%) at the normal (p < 0.05, *) significance level, indicating that the major metabolite differences are not dependent on the normalization strategy.
Figure 5
Figure 5
Supervised clustering of colon cancer tissue and normal colon mucosa with respect to 82 differentially regulated metabolites. The heatmap visualizes the abundance of each of the metabolites in each of the samples ranging from high (red) over average (black) to low (green).
Figure 6
Figure 6
Validation of predictive models for the separation of colon cancer from normal tissues based on 2, 3, 4, ..., 206 metabolites. Sensitivity and specificity were calculated in a leave-one-out approach. A: nearest centroid classification (NCC), B: nearest mean classification (NMC), C: linear discriminant analysis (LDA), D: linear support vector machines (SVM). E/F: Validation of nearest centroid classification (NCC) with 206 metabolites by looking at training data sets with n = 6, 8, ..., 34 samples. For each size n, 1000 training data sets were generated by randomly drawing n/2 tumors and n/2 normal tissues from the 45 samples. The remaining 45-n samples were used as test data. Sensitivity (E) and specificity (F) were reported and their distributions were visualized as box plots. The boundaries of boxes and whiskers mark the 5th, 25th, 50th, 75th, and 95th percentile.
Figure 7
Figure 7
PROFILE analysis – comparison of metabolic differences between colon cancer and normal tissue clustered according to the relational pathway information from the KEGG REACTION database. Significance of the metabolic differences is designated by the stars behind the metabolite names: *** (high significance, p < 0.00024), ** (medium significance, p < 0.01), * (low significance, p < 0.05). The scale at the dendrogram refers to the number of main reactions in the KEGG database that link the metabolites to each other.

Similar articles

Cited by

References

    1. Jemal A, Siegel R, Ward E, Murray T, Xu J, Thun MJ. Cancer statistics, 2007. CA Cancer J Clin. 2007;57:43–66. - PubMed
    1. Cousins RJ. Nutritional regulation of gene expression. Am J Med. 1999;106:20S–23S. - PubMed
    1. Jump DB. Fatty acid regulation of gene transcription. Crit Rev Clin Lab Sci. 2004;41:41–78. - PubMed
    1. Mariadason JM, Corner GA, Augenlicht LH. Genetic reprogramming in pathways of colonic cell maturation induced by short chain fatty acids: comparison with trichostatin A, sulindac, and curcumin and implications for chemoprevention of colon cancer. Cancer Res. 2000;60:4561–72. - PubMed
    1. Gunter MJ, Leitzmann MF. Obesity and colorectal cancer: epidemiology, mechanisms and candidate genes. J Nutr Biochem. 2006;17:145–56. - PubMed

LinkOut - more resources