. 2008 Dec;19(12):5550-8.
doi: 10.1091/mbc.e08-06-0645. Epub 2008 Sep 17.

The Hsk1(Cdc7) replication kinase regulates origin efficiency

Affiliations

The Hsk1(Cdc7) replication kinase regulates origin efficiency

Prasanta K Patel et al. Mol Biol Cell. 2008 Dec.

Abstract

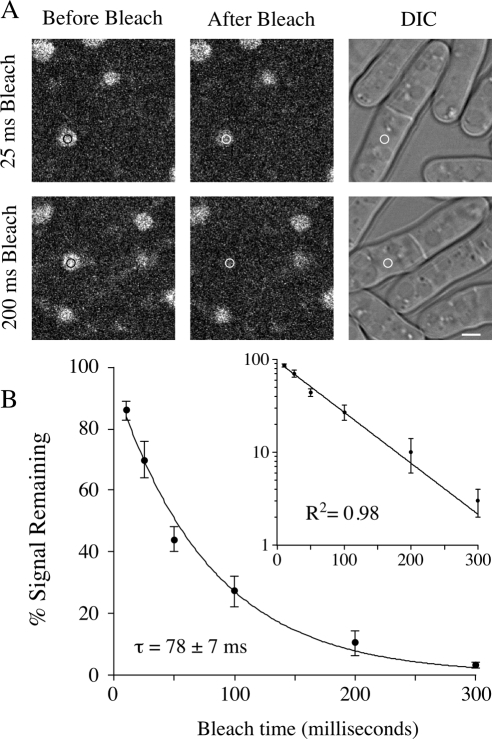
Origins of DNA replication are generally inefficient, with most firing in fewer than half of cell cycles. However, neither the mechanism nor the importance of the regulation of origin efficiency is clear. In fission yeast, origin firing is stochastic, leading us to hypothesize that origin inefficiency and stochasticity are the result of a diffusible, rate-limiting activator. We show that the Hsk1-Dfp1 replication kinase (the fission yeast Cdc7-Dbf4 homologue) plays such a role. Increasing or decreasing Hsk1-Dfp1 levels correspondingly increases or decreases origin efficiency. Furthermore, tethering Hsk1-Dfp1 near an origin increases the efficiency of that origin, suggesting that the effective local concentration of Hsk1-Dfp1 regulates origin firing. Using photobleaching, we show that Hsk1-Dfp1 is freely diffusible in the nucleus. These results support a model in which the accessibility of replication origins to Hsk1-Dfp1 regulates origin efficiency and provides a potential mechanistic link between chromatin structure and replication timing. By manipulating Hsk1-Dfp1 levels, we show that increasing or decreasing origin firing rates leads to an increase in genomic instability, demonstrating the biological importance of appropriate origin efficiency.


Figures

Figure 1.
Figure 1.
Hsk1-Dfp1 is rate determining for origin firing. (A) The ura4 region of chromosome III and representative combed molecules. The graphic represents the left end of chromosome III. Blue represents coding sequences, black noncoding sequences, green noncoding sequences predicted to be origins by AT richness (Segurado et al., 2003), and yellow ura4. Predicted origins are labeled above with the systematic nomenclature of Segurado et al. (2003). An additional locus, labeled AT3002.8 and shown in pink, is just below the AT-threshold used for origin prediction. Origins AT3004 and AT3005 are too close together to be reliably distinguished by combing and are treated as one origin. The red bars represent the FISH probes used to identify molecules from this region. Two representative molecules labeled with BrdU and identified with the FISH probes are shown; the top molecule is from hsk1-ts (yFS457); the bottom molecule is from adh1:dfp1 (yFS458). The BrdU signals scored as replication bubbles are indicated by green lines below the images. The greater length of the replication patch in the top image is presumably due to fewer origins firing in the hsk1-ts cell, so the replications forks go farther before depleting nucleotides and stalling. The length and continuity of all molecules were determined with anti-guanosine antibodies, which label DNA (data not shown). (B) A graphic table of origin use in the ura4 region. hsk1-ts (yFS457), wild type (yFS240), and adh1:dfp1 (yFS458) were analyzed for origin efficiency. The data for wild type (yFS240) is from Patel et al. (2006). Each row represents a DNA molecule; each column represents an origin in the region. A green box indicates the origin fired on that molecule; a hatched box indicates it did not; no box indicates that the fiber did not extend to include that origin. Below the table is the quantitation of the origin efficiencies. (C) Quantitation of the origin efficiencies in B.
Figure 2.
Figure 2.
Hsk1-Dfp1 acts in cis to regulate origin firing. (A) 5 Gal4 DNA-binding sites were integrated adjacent to origin AT3003. The sites are ∼3 kb from AT3003, 6 kb from 3002.8, and 40 kb from both AT3002 and AT3004. A map of the region is shown below the graph, with origins depicted as gray boxes and the Gal4 DNA-binding sites as a black box. The position, but not the size, of the boxes is to scale. Origin efficiency in a strain expressing Dfp1 fused to the DNA-binding domain of Gal4 (yFS459) was determined as in Figure 1. A strain with Gal4 sites integrated at ars727 (yFS460) was used as the control. Forty-seven fibers were examined for yFS459 and 63 for yFS460. p values in parentheses for pairwise comparisons of efficiencies are from Fisher's exact test. (B) As in A, except the Gal4 DNA-binding sites were integrated adjacent to AT2103 (yFS460, in which the sites are ∼3 kb from AT2103, 17 kb from AT2102, 32 kb from AT2104, and 45 kb from AT2101); a strain with Gal4 sites integrated at origin AT3003 (yFS459) was used as the control. Fifty-three fibers were examined for yFS460 and 60 for yFS459.
Figure 3.
Figure 3.
Hsk1-Dfp1 is freely diffusible in the nucleus. (A) dfp1-GFP cells (yFS449) were imaged before and after bleaching for the indicated time with an SP2 laser scanning confocal microscope (Leica, Wetzlar, Germany). Bleaching was preformed with the spot bleach function in the area indicated by the circle. Scale bars represent 2 μm. We see defuse nuclear localization of Dfp1 at all cell cycle stages, which is not inconsistent with the previous reports of punctate localization of Dfp1 homologues in G1 and S, because previous studies have used fixed cells that may well preferentially retain protein at sites of transient association (Pasero et al., 1999; Masai et al., 2006). (B) The total nuclear fluorescence was measured before and after bleaching. The data represent the average of three to seven experiments; the error bars represent the SE of the mean. The inset shows the same data on a semi-log plot.
Figure 4.
Figure 4.
Hsk1-Dfp1 levels affect plasmid and chromosome stability. (A) Wild-type (yFS240), hsk1-ts (yFS457), and adh1:dfp1 (yFS458) strains carrying plasmids with one copy (pFS118) or two copies of ars3002 (pDblet) were analyzed for plasmid loss rates. The data represent the average and SD of three independent experiments. (B) Wild-type (yFS461), adh1:dfp1 (yFS463), cds1Δ (yFS462), and adh1:dfp1 cds1Δ (yFS464) strains carrying the nonessential minichromosome Ch16 were analyzed for Ch16 loss rates in the presence or absence of 1 mM hydroxyurea.

Comment in

  • Mol Biol Cell. 19:5031.

References

    1. Alvino G. M., Collingwood D., Murphy J. M., Delrow J., Brewer B. J., Raghuraman M. K. Replication in hydroxyurea: it's a matter of time. Mol. Cell. Biol. 2007;27:6396–6406. - PMC - PubMed
    1. Axelrod D., Koppel D. E., Schlessinger J., Elson E., Webb W. W. Mobility measurement by analysis of fluorescence photobleaching recovery kinetics. Biophys. J. 1976;16:1055–1069. - PMC - PubMed
    1. Bechhoefer J., Marshall B. How Xenopus laevis replicates DNA reliably even though its origins of replication are located and initiated stochastically. Phys. Rev. Lett. 2007;98 098105. - PubMed
    1. Bensimon A., Simon A., Chiffaudel A., Croquette V., Heslot F., Bensimon D. Alignment and sensitive detection of DNA by a moving interface. Science. 1994;265:2096–2098. - PubMed
    1. Bousset K., Diffley J. F. The Cdc7 protein kinase is required for origin firing during S phase. Genes Dev. 1998;12:480–490. - PMC - PubMed

Publication types

MeSH terms