. 2008 Sep 17;28(38):9349-62.
doi: 10.1523/JNEUROSCI.3195-08.2008.

Metabolic environment in substantia nigra reticulata is critical for the expression and control of hypoglycemia-induced seizures

Affiliations

Metabolic environment in substantia nigra reticulata is critical for the expression and control of hypoglycemia-induced seizures

Libor Velísek et al. J Neurosci. .

Abstract

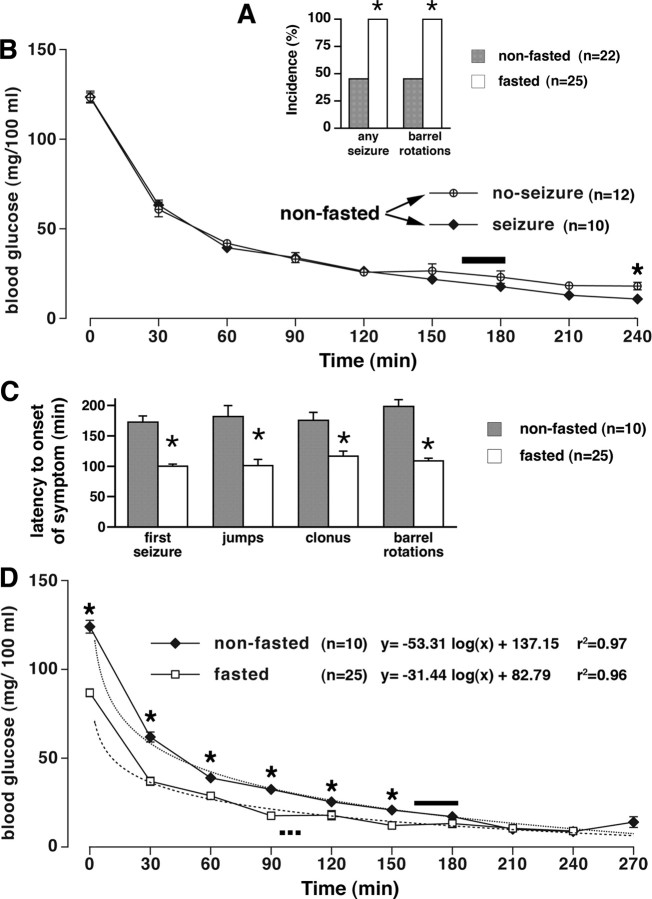
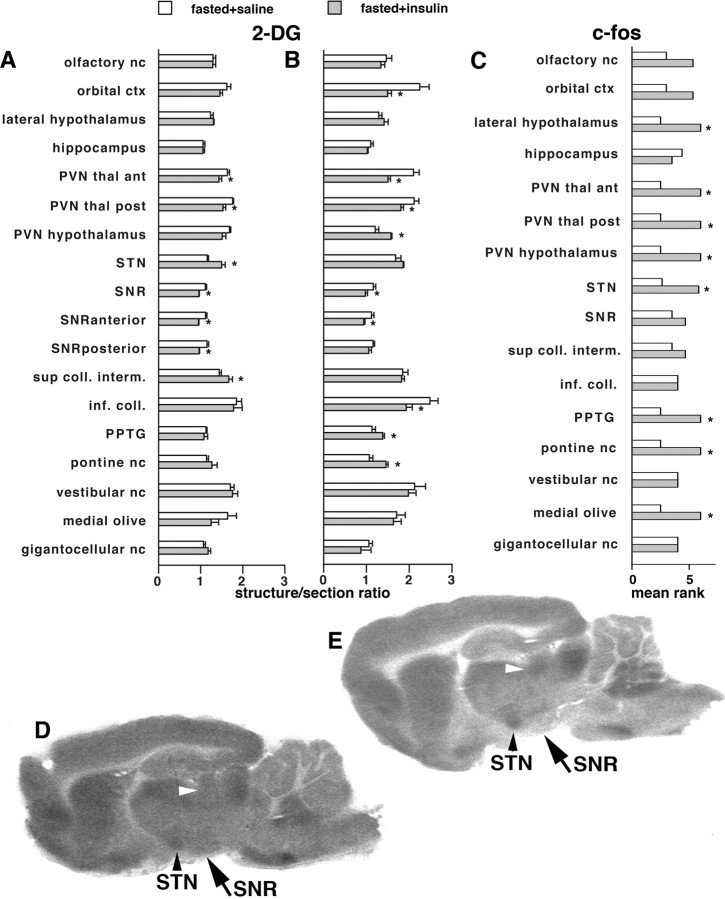
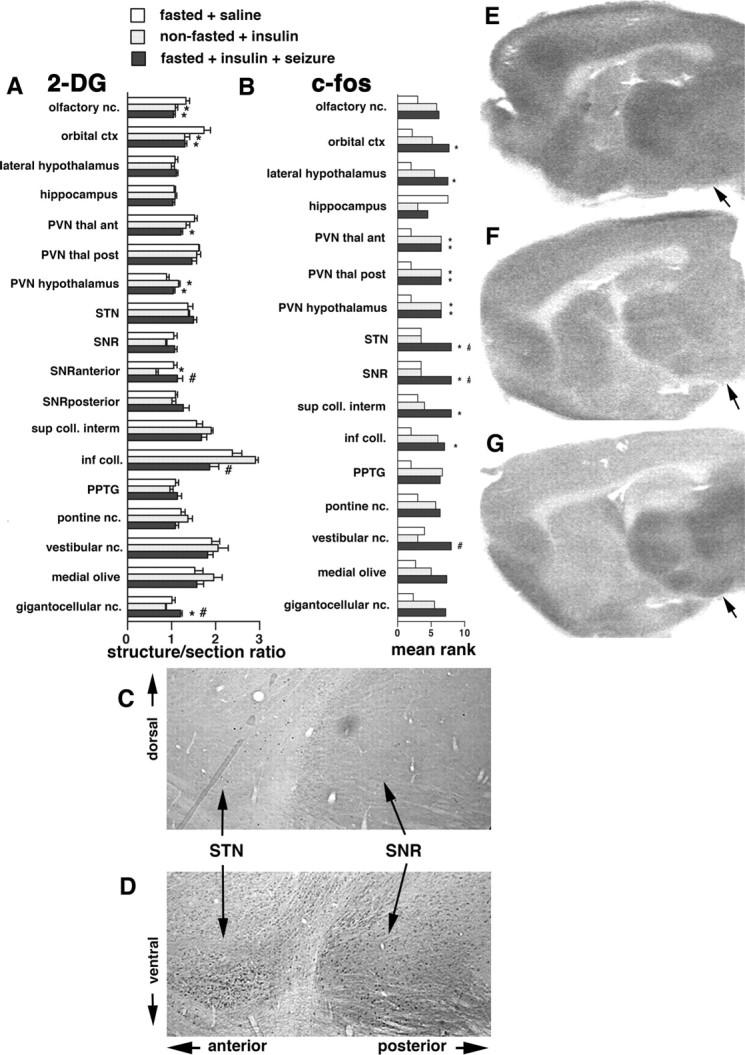
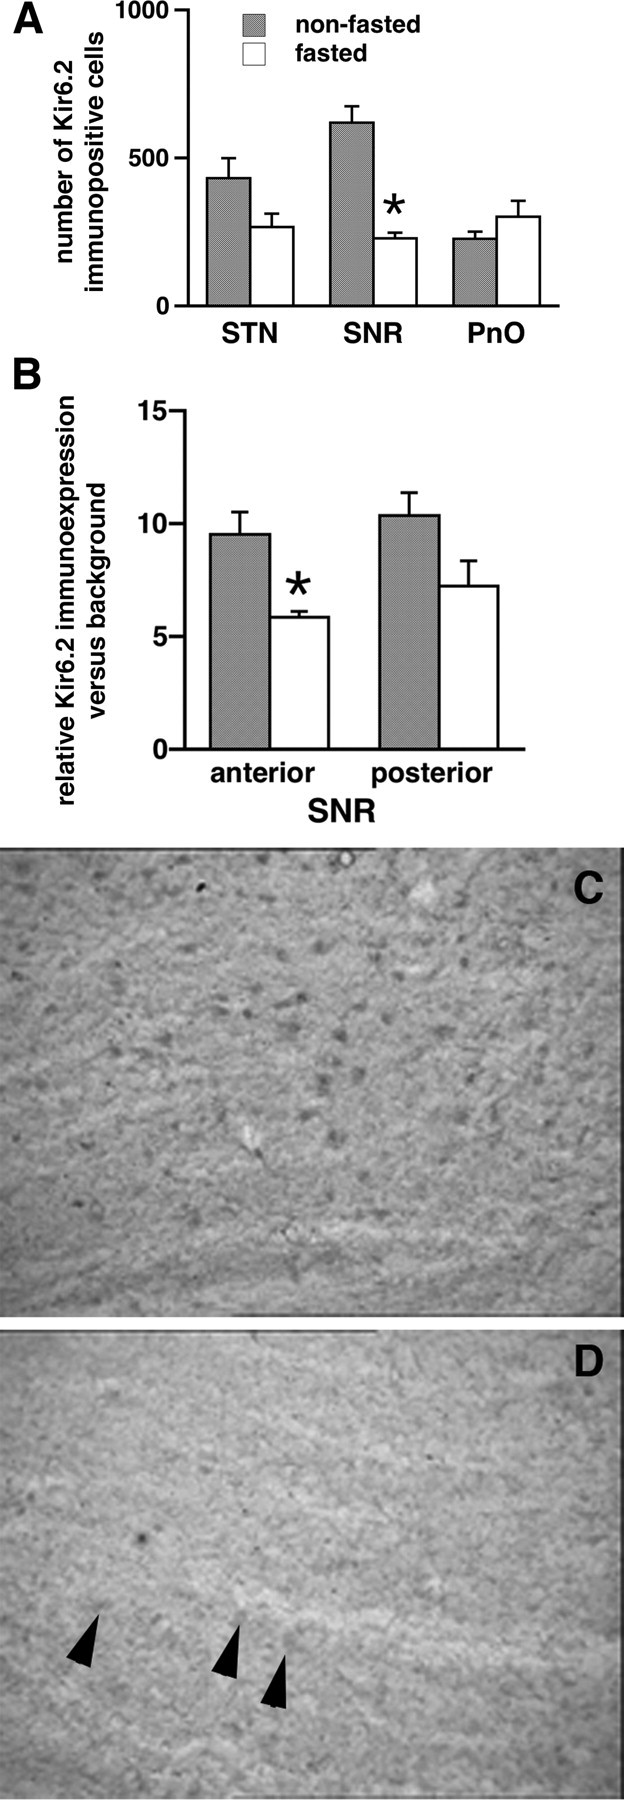
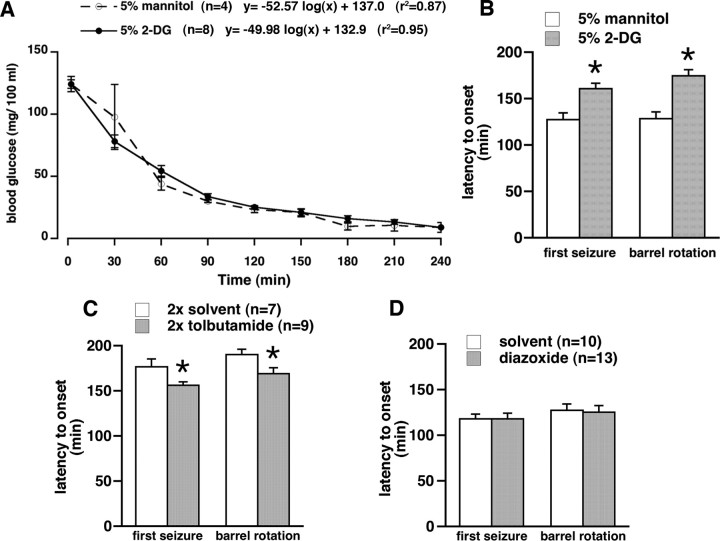
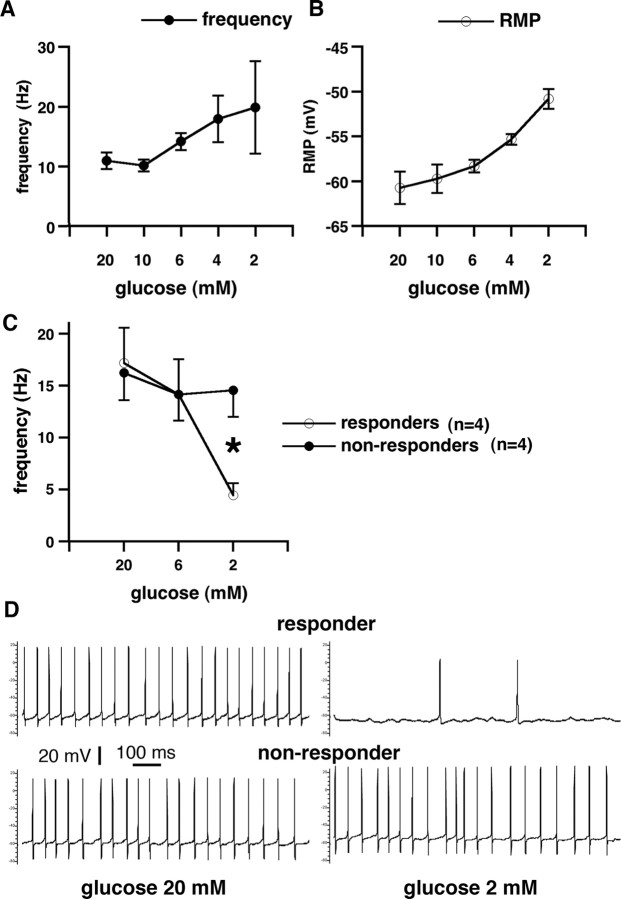
Seizures represent a common and serious complication of hypoglycemia. Here we studied mechanisms of control of hypoglycemic seizures induced by insulin injection in fasted and nonfasted rats. We demonstrate that fasting predisposes rats to more rapid and consistent development of hypoglycemic seizures. However, the fasting-induced decrease in baseline blood glucose concentration cannot account for the earlier onset of seizures in fasted versus nonfasted rats. Data obtained with c-Fos immunohistochemistry and [14C]2-deoxyglucose uptake implicate a prominent involvement of the substantia nigra reticulata (SNR) among other structures in the hypoglycemic seizure control. This is supported by data showing that fasting decreases the SNR expression of K(ATP) channels, which link metabolism with activity, and is further confirmed with microinfusions of K(ATP) channel agonist and antagonist. Data obtained with whole-cell and perforated patch recordings from SNR neurons in slices in vitro demonstrate that both presynaptic and postsynaptic K(ATP) channels participate in the failure of the SNR to control hypoglycemic seizures. The results suggest that fasting and insulin-induced hypoglycemia can lead to impairment in the function of the SNR, leading thus to hypoglycemic seizures.


Figures

Figure 1.
Figure 1.
Hypoglycemic seizures induced by insulin in fasted and nonfasted rats. A, The incidence of insulin-induced (30 IU/kg, i.p.) seizures as well as barrel rotations was significantly higher in fasted (25 of 25) than in nonfasted (10 of 22) rats (*p < 0.0001, Fisher's exact test). B, Decrease in blood glucose over time in nonfasted rats experiencing seizures (n = 10) was not significantly different from nonfasted rats without seizures (n = 12), except for the last interval at 240 min after insulin (*p < 0.05, t test). Solid bar above the fitted curves indicates time of the first seizure onset (mean ± SEM) in the 10 rats. C, Hypoglycemic seizures occurred earlier in the fasted rats (n = 25) than in nonfasted (n = 10) rats (*p for all symptoms <0.001, t test). The first pair of bars indicates the latency to onset of any first seizure regardless of type (jumps, clonic seizures, and barrel rotations combined). The additional pairs of bars compare individual behaviors separately. D, Decrease in blood glucose over time in fasted and nonfasted rats experiencing seizures. There was a significant difference in initial blood glucose as well as in blood glucose at the time points up to 150 min after insulin (*p < 0.05, t test). This blood glucose decrease over time has a very precise logarithmic fit (see r 2 values). Dotted bar indicates time of the first seizure onset for the fasted group (n = 25; mean ± SEM), and the solid bar indicates time of the first seizure onset for the nonfasted group (n = 10; mean ± SEM).
Figure 2.
Figure 2.
Electroencephalographic and behavioral events associated with hypoglycemia. A, EEG recordings obtained with barrel rotations during profound hypoglycemia. PPTg, Pedunculopontine tegmental nucleus, hippocampus, and (neo)cortex recordings. Seizure activity started as fast, low-amplitude spikes (arrow) almost simultaneously in all recorded areas. The barrel rotations occurred after the onset of the EEG discharge (the arrowhead marks the artifact induced by a barrel rotation). Calibration: 2 s, 500 μV. B, Individual frames from a video recording depicting a rat undergoing two barrel rotations. C, EEG recordings during a seizure developing during the recovery from hypoglycemia after intraperitoneal glucose administration. D, The behavioral correlate of the EEG seizure shown in C. The behavioral seizure consisted of rearing and face and forelimb clonus and was similar to forebrain seizures occurring after kindling, pilocarpine, or kainic acid (Racine, 1972; Ben-Ari, 1985; Cavalheiro et al., 1987).
Figure 3.
Figure 3.
Identification of structures activated before seizure development using c-Fos expression and 2-DG uptake. A, 2-DG uptake in fasted rats 30 min after the injection of either saline (normoglycemic, fasted + saline) or insulin (hypoglycemic, fasted + insulin). The relative uptake was determined in autoradiograms as the calibrated optical density value of the region of interest versus calibrated optical density of the entire section (structure-to-section ratio). Groups were compared using t test, *p < 0.05. There were significant decreases in 2-DG uptake during hypoglycemia in the paraventricular nuclei of the thalamus and SNR (both anterior and posterior part) and increases in the STN and intermediate layers of the superior colliculus. B, 2-DG uptake in fasted rats 60 min after the injection of either saline or insulin. The relative uptake was determined as above. With time, 2-DG uptake further decreased in the paraventricular thalamic nuclei, in the SNR, and in the inferior colliculus. Significant increases were observed in the paraventricular hypothalamic nucleus (PVN hypothalamus), PPTg, and pontine reticular nucleus, oral part (pontine nc.). C, Ranks of c-Fos scores in brain structures in the two groups of fasted rats (normoglycemic, fasted + saline; hypoglycemic, fasted + insulin) at 90 min after saline or insulin injection. The semiquantitative scores were assigned (see Materials and Methods) (Samoriski et al., 1997; Silveira et al., 2002). As the scores were evaluated using nonparametric Mann–Whitney test, mean ranks are shown with *p < 0.05. D, Example of brain 2-DG uptake in the fasted rat injected with saline at 30 min after injection; sagittal section at the level −1.9 mm according to Paxinos and Watson (1998). White arrowhead points to the intermediate layer of the superior colliculus, black arrowhead marks the STN, and the arrow points to the SNR. E, Example of brain 2-DG uptake in the fasted rat injected with insulin at 30 min of hypoglycemia; sagittal section at the level −1.9 mm according to Paxinos and Watson (1998). Please note the relative increase in the 2-DG uptake in the STN and the superior colliculus and a substantial decrease in the SNR, especially in the anterior part; compared with D.
Figure 4.
Figure 4.
Identification of structures maintaining activation during and after hypoglycemic seizure. A, 2-DG uptake 45 min after the onset of hypoglycemic seizures in the fasted + insulin + seizure group or at matching times after the injection in the other two groups (fasted + saline and nonfasted + insulin). The relative uptake was determined in autoradiograms as described in Figure 3 (structure-to-section ratio). Statistical analysis was performed using ANOVA with post hoc Fisher's PLSD test; *p < 0.05 versus the fasted + saline group; # p < 0.05 versus the nonfasted + insulin group. Note that, in the nonfasted + insulin rats, the SNR metabolic activity is low compared with the fasted + saline and fasted + insulin + seizures rats. Accordingly, metabolic activity in superior colliculus is decreased in the fasted + insulin + seizure group as a complement to increased SNR metabolic activity of the same group. B, Ranks of c-Fos scores in brain structures in the three groups of rats (fasted + saline, nonfasted + insulin, and fasted + insulin + seizure) at 120 min after the seizure onset in the seizure group or matched times in the other two groups. Mean ranks are presented (*p < 0.05 vs fasted + saline; # p < 0.05 vs nonfasted + insulin group). From all the evaluated structures, we found significant increases in c-Fos expression in the rats with hypoglycemia and seizures compared with the rats with comparable hypoglycemia only in the SNR, STN, and the vestibular nuclei. C, Example of the c-Fos expression in the SNR and STN in a nonfasted rat with insulin-induced hypoglycemia at 120 min after the other group developed seizures. Note that there are only individual c-Fos-positive cells in both structures. D, Example of the c-Fos expression in the SNR and STN in a fasted rat with insulin-induced hypoglycemia and seizures at 120 min after the seizures occurred (matched time for the rat shown in E). Note that both the STN and SNR are packed with c-Fos-immunopositive cells, indicating strong activation of these structures. E, An example of 2-DG uptake in a sagittal brain section in a fasted rat with saline injection. The arrow points to the middle of the SNR. F, An example of 2-DG uptake in a sagittal brain section in a nonfasted rat with insulin injection. The 2-DG uptake in the SNR is decreased compared with E. G, An example of 2-DG uptake in a sagittal brain section of a fasted rat with insulin injection and seizures. The 2-DG uptake in the SNR is increased compared with F.
Figure 5.
Figure 5.
Kir6.2 expression in the SNR in fasted rats is decreased compared with nonfasted rats. A, Number of Kir6.2-immunopositive cells in the STN, SNR, and PnO of fasted (n = 5) and nonfasted (n = 5) rats. There was a significant decrease in the number of Kir6.2-immunopositive cells only in the SNR (*p < 0.05, t test). B, Densitometry (Ravizza et al., 2002) of the Kir6.2 immunoexpression in the SNR cells at the matching sections (10 cells at each of 3 sections per structure per rat) with the goal of comparison of the fasted (n = 6) and nonfasted (n = 6) rats. In the anterior part of the SNR of fasted rats, the Kir6.2 immunointensity was significantly lower than in nonfasted rats (*p < 0.05, t test). C, An example of a sagittal section through the SNR in a nonfasted rat demonstrating many Kir6.2-immunopositive cells. D, An example of a sagittal section through the SNR in a fasted rat demonstrating few Kir6.2-immunopositive cells.
Figure 6.
Figure 6.
Effects of drug microinfusions in the SNR on hypoglycemic seizures. A, Decrease of blood glucose with time after insulin injection in the two groups of nonfasted rats used for the experiment illustrated in B. There was no difference between the groups. There was a very good logarithmic fit, almost identical to the curve fit for the nonfasted rats in the Figure 1. B, Microinfusion of nonradioactive 2-DG, a glucose anti-metabolite, in the anterior part of the SNR (0.5 μl of the 5% solution per site), significantly delayed onset of first seizure and barrel rotation after insulin injection compared with rats microinjected with the same volume of 5% mannitol (mean ± SEM; *p < 0.05, t test). This finding is consistent with opening of postsynaptic KATP channels because of acute ATP deficiency resulting in hyperpolarization and decreased firing of the SNR neurons, and therefore, with anticonvulsant effects (Velíšková and Moshé, 2006). C, Double microinfusion of tolbutamide, a KATP channel blocker, in the anterior part of the SNR (0.25 μl of the 4 mm solution) of nonfasted rats at 24 h and immediately before insulin significantly accelerated onset of first seizure and barrel rotation compared with rats microinfused with solvent (DMSO/β-cyclodextrine mixture, 5:1 ratio; mean ± SEM; *p < 0.05, t test). This finding is consistent with closing of postsynaptic KATP channels resulting in depolarization and increased firing of the SNR neurons and, thus, proconvulsant effects (Velíšková and Moshé, 2006). D, Microinfusion of diazoxide, a KATP channel opener, in the anterior part of the SNR (0.25 μl of the 4 mm solution) of fasted rats did not change susceptibility to development of hypoglycemic seizures compared with rats microinfused with solvent (0.1N NaOH plus PBS), indicating that the effector system (postsynaptic KATP channels) may have been unavailable as suggested by decreased Kir6.2 subunit expression in fasted rats (Fig. 5).
Figure 7.
Figure 7.
Single-cell recordings in the GABAergic cells of the SNR during decreases of extracellular glucose. A, Whole cell, 2 mm ATP in the electrode: frequency of GABAergic cell discharges (y-axis) is plotted versus extracellular glucose concentration (x-axis). The frequency of discharges significantly increased with decreasing extracellular glucose, reaching the highest firing rate at 2 mm extracellular glucose concentration (36 mg/100 ml). This indicates a significant contribution of presynaptic KATP channels in the increased postsynaptic firing, as postsynaptic ATP was clamped. B, Whole cell, 2 mm ATP in the electrode: resting membrane potential (y-axis) is plotted versus extracellular glucose concentration (x-axis). Resting membrane potential of the recorded cells significantly decreased in the decreasing glucose concentration. This finding is consistent with increased firing frequency. Furthermore, this illustrates that, in this case, the postsynaptic membrane cannot be affected by changes in intracellular ATP (clamped at 2 mm). Therefore, if postsynaptic intracellular ATP is kept constant, the effects of presynaptic ATP deficiency prevail, which result in a decreased release of GABA (During et al., 1995) from multiple GABAergic terminals predominantly of striatal origin (Bevan et al., 1996) and, thus, in increased postsynaptic firing. C, Gramicidin perforated patch clamp: frequency of GABAergic cell discharges (y-axis) is plotted versus extracellular glucose concentration (x-axis). This recording arrangement evaluated contribution of both presynaptic and postsynaptic KATP channels as postsynaptic ATP was allowed to fluctuate according to the metabolic state. The population of cells divided into two subpopulations: responders, which significantly decreased their firing rate with the decrease of extracellular glucose compared with nonresponders, in which the firing rate remained almost constant even after 10 min in 2 mm glucose concentration (p < 0.05, t test). In the hippocampus, this concentration of extracellular glucose may completely shut down synaptic transmission (Kirchner et al., 2006). D, Gramicidin perforated patch clamp: recording from electrophysiologically identified GABAergic neurons. The first neuron was spontaneously active with action potential firing at ∼19 Hz in 20 mm extracellular glucose concentration (top left). After decrease of extracellular glucose concentration to 2 mm, the frequency of action potentials decreased to 2 Hz (top right). This neuron is referred to as responder. Another neuron was spontaneously firing action potentials at ∼18 Hz in 20 mm extracellular glucose (bottom left). After extracellular glucose decreased to 2 mm, the firing frequency was maintained (bottom right). This neuron is referred to as a nonresponder.

Similar articles

Cited by

References

    1. Abdelmalik PA, Shannon P, Yiu A, Liang P, Adamchik Y, Weisspapir M, Samoilova M, Burnham WM, Carlen PL. Hypoglycemic seizures during transient hypoglycemia exacerbate hippocampal dysfunction. Neurobiol Dis. 2007;26:646–660. - PubMed
    1. Ackermann RF, Finch DM, Babb TL, Engel J., Jr Increased glucose metabolism during long-duration recurrent inhibition of hippocampal pyramidal cells. J Neurosci. 1984;4:251–264. - PMC - PubMed
    1. Acosta-Martínez M, Levine JE. Regulation of KATP channel subunit gene expression by hyperglycemia in the mediobasal hypothalamus of female rats. Am J Physiol Endocrinol Metab. 2007;292:E1801–E1807. - PubMed
    1. Akasu T, Tsurusaki M, Shoji S. Depletion of glucose causes presynaptic inhibition of neuronal transmission in the rat dorsolateral septal nucleus. Synapse. 1996;24:125–134. - PubMed
    1. Allen TG, Brown DA. Modulation of the excitability of cholinergic basal forebrain neurones by KATP channels. J Physiol. 2004;554:353–370. - PMC - PubMed

Publication types

MeSH terms