. 2008 Sep 17;28(38):9414-25.
doi: 10.1523/JNEUROSCI.3196-08.2008.

Time constants of h current in layer ii stellate cells differ along the dorsal to ventral axis of medial entorhinal cortex

Affiliations

Time constants of h current in layer ii stellate cells differ along the dorsal to ventral axis of medial entorhinal cortex

Lisa M Giocomo et al. J Neurosci. .

Abstract

Chronic recordings in the medial entorhinal cortex of behaving rats have found grid cells, neurons that fire when the rat is in a hexagonal array of locations. Grid cells recorded at different dorsal-ventral anatomical positions show systematic changes in size and spacing of firing fields. To test possible mechanisms underlying these differences, we analyzed properties of the hyperpolarization-activated cation current I(h) in voltage-clamp recordings from stellate cells in entorhinal slices from different dorsal-ventral locations. The time constant of h current was significantly different between dorsal and ventral neurons. The time constant of h current correlated with membrane potential oscillation frequency and the time constant of the sag potential in the same neurons. Differences in h current could underlie differences in membrane potential oscillation properties and contribute to grid cell periodicity along the dorsal-ventral axis of medial entorhinal cortex.


Figures

Figure 1.
Figure 1.
Example of properties of a single stellate cell in current clamp, in voltage clamp, and in the presence of ZD7288 (location 5.0 mm from the dorsal surface of the brain). a, Stellate cells show a prominent sag in the membrane potential (top) in response to a hyperpolarizing current injection (bottom). b, c, The same neuron shows prominent subthreshold membrane potential oscillations when the cell nears firing threshold. d, Subthreshold membrane potential oscillations are reduced in the presence of 10 μm ZD7288. e, In the same neuron, voltage-clamp steps (bottom) evoke an inward current (top) because of activation of Ih. f, The inward current observed is completely blocked by application of 100 μm ZD7288 in the same cell. g, Subtraction of traces collected in the presence of ZD7288 from the control traces results in an isolated trace. The isolated trace can be fit with a dual-exponential equation to determine the time constant of Ih activation and deactivation.
Figure 2.
Figure 2.
Time constant of Ih activation and deactivation changes along the dorsal–ventral axis of medial entorhinal cortex. Error bars indicate SEM. a, Subtracted current traces from two cells, one more dorsal (black, left) and one more ventral (gray, right) during hyperpolarizing steps in voltage clamp. b, The fast time constant of Ih is faster in more dorsal portions of mEC compared with more ventral portions at multiple voltages. c, The slow time constant of Ih is faster in more dorsal portions of mEC compared with more ventral portions at multiple voltages. d, Fast time constant of Ih increases from dorsal to ventral medial entorhinal cortex (distance from dorsal surface, in millimeters) at multiple voltages (from left to right: −45, −50, −70, and −80 mV). The time constant of Ih begins to saturate at very hyperpolarized potentials and the change in the time constant of Ih along the dorsal–ventral axis has a smaller slope (far right, −110 mV). e, Average fast time constant of Ih is faster in dorsal (black diamonds) compared with ventral (open squares) cells across all voltages tested. f, Average slow time constant of Ih is faster in dorsal (black diamonds) compared with ventral (open squares) cells across almost all voltages tested. g, Average fast time constant of Ih for all stellate cells. h, Average fast time constant of Ih for all pyramidal-like cells.
Figure 3.
Figure 3.
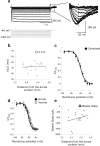
Steady-state activation is similar in stellate cells along the dorsal–ventral axis. Error bars indicate SEM. a, The neuron is clamped at −40 mV and a 3-s-long hyperpolarizing voltage step delivered (left). When the voltage is stepped back up to −40 mV, a tail current is observed (right). Current is measured (dotted line) relative to baseline and normalized to the maximum current measured. b, The V1/2 did not systematically change along the dorsal–ventral axis of medial entorhinal cortex. c, Average steady-state activation curve for all stellate cells combined. d, Steady-state activation curves were similar in dorsal compared with ventral neurons, with ventral cells showing a slightly more depolarized V1/2. e, Steady-state amplitude (in picoamperes) for cells did not significantly differ along the dorsal–ventral axis of medial entorhinal cortex.
Figure 4.
Figure 4.
Bath application of 100 μm ZD7288, a specific blocker of Ih, reduces subthreshold membrane oscillations. a, Three different stellate cells show prominent subthreshold membrane oscillations at an approximate membrane potential of −45 mV (top), −50 mV (middle), and −52 (bottom) in control conditions (left). After a 10 min perfusion of 100 μm ZD7288, oscillations at the same membrane potential are reduced in amplitude and frequency (right). b, Example of subthreshold oscillations just after an action potential, at an approximate membrane potential of −50 mV (top). After 10 min perfusion of 100 μm ZD7288, the oscillations at the same membrane potential are reduced in amplitude and frequency after an action potential (bottom). c, Three different stellate cells show prominent subthreshold membrane oscillations at an approximate membrane potential of −53 mV (top), −51 mV (middle), and −48 mV (bottom) in control conditions (left). After a 10 min perfusion of 10 μm ZD7288, oscillations at the same membrane potential are reduced in amplitude and frequency (right). d, Frequency of subthreshold oscillations in eight different stellate cells in control conditions and the subsequent subthreshold membrane oscillation frequency after a 10 min perfusion of either 100 μm ZD7288 (black triangles) or 10 μm ZD7288 (white squares).
Figure 5.
Figure 5.
Frequency of subthreshold membrane oscillations correlates with time constant of Ih. Data are shown for six neurons located along the dorsal to ventral axis of medial entorhinal cortex. For each cell, a shows a 3 s sample of membrane potential oscillations at −50 mV, b shows the corresponding isolated Ih voltage-clamp trace, and c shows time constants derived from trace b. The distance from the dorsal surface (the dorsal–ventral location) and the measured oscillation frequency is shown above the oscillation trace for each cell in a.
Figure 6.
Figure 6.
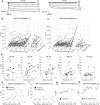
Subthreshold membrane potential oscillation frequency changes along dorsal–ventral axis and correlates with the time constant of Ih. a, The mean frequency of subthreshold oscillations is higher in dorsal compared with ventral cells at −50 and −45 mV. Membrane oscillations are similar in both dorsal and ventral portions of medial entorhinal cortex at −55 mV. b, The frequency of subthreshold oscillations at −50 mV correlates with the time constant of Ih at a voltage of −45 mV (b1), −50 mV (b2), and −65 mV (b3). c, At a voltage of −80 mV, the time constant of Ih correlates with the frequency of membrane oscillations at −50 mV, but the data points begin to cluster together. d, The average time constant of Ih at −45, −50, and −65 mV correlates with the frequency of subthreshold oscillations at −50 mV.
Figure 7.
Figure 7.
Time constant of sag potential correlates with time constant of Ih. a, Examples of sag potential from cells located along the dorsal to ventral axis (from top to bottom: 4.2, 4.9, 5.4 mm from the dorsal surface). b, The time constant of the sag potential (at −75 to −70 mV) changes along the dorsal–ventral axis, with faster time constants in dorsal compared with ventral medial entorhinal cortex. c, Time constant of the sag at −75 to −70 mV correlates with the frequency of subthreshold oscillations at −50 mV. d, Time constant of the sag potential (at −75 to −70 mV) correlates with the time constant of Ih at (from left to right) −45 mV, −50 mV, and the average time constant of Ih for both voltages.

References

    1. Acker CD, Kopell N, White JA. Synchronization of strongly coupled excitatory neurons: relating network behavior to biophysics. J Comput Neurosci. 2003;15:71–90. - PubMed
    1. Alonso A, Klink R. Differential electroresponsiveness of stellate and pyramidal-like cells of medial entorhinal cortex layer II. J Neurophysiol. 1993;70:128–143. - PubMed
    1. Alonso A, Llinás RR. Subthreshold Na-dependent theta-like rhythmicity in stellate cells of entorhinal cortex layer II. Nature. 1989;342:175–177. - PubMed
    1. Barry C, Hayman R, Burgess N, Jeffery KJ. Experience-dependent rescaling of entorhinal grids. Nat Neurosci. 2007;10:682–684. - PubMed
    1. Brownlee H, Gao PP, Frisen J, Dreyfus C, Zhou R, Black IB. Multiple ephrins regulate hippocampal neurite outgrowth. J Comp Neurol. 2000;425:315–322. - PubMed

Publication types

LinkOut - more resources