

Differences between two real-time PCR-based hepatitis C virus (HCV) assays (RealTime HCV and Cobas AmpliPrep/Cobas TaqMan) and one signal amplification assay (Versant HCV RNA 3.0) for RNA detection and quantification
- PMID: 18799708
- PMCID: PMC2593291
- DOI: 10.1128/JCM.00755-08
Differences between two real-time PCR-based hepatitis C virus (HCV) assays (RealTime HCV and Cobas AmpliPrep/Cobas TaqMan) and one signal amplification assay (Versant HCV RNA 3.0) for RNA detection and quantification
Abstract
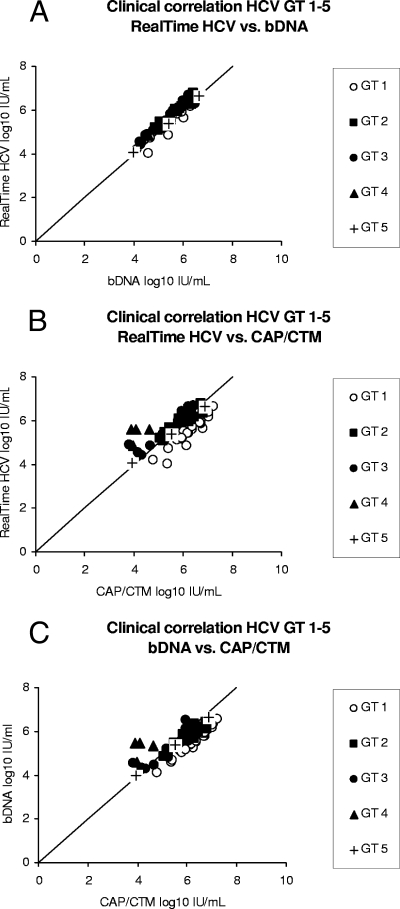
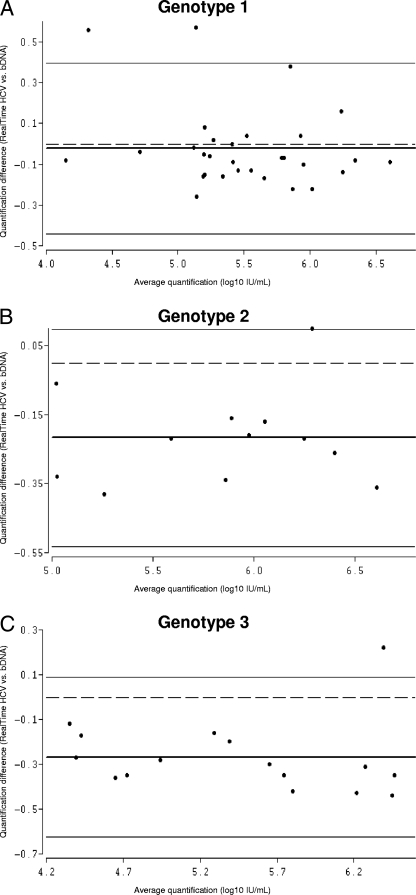
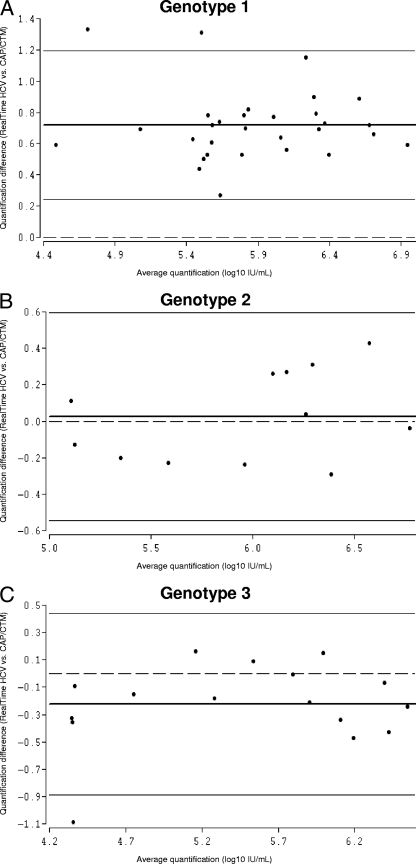
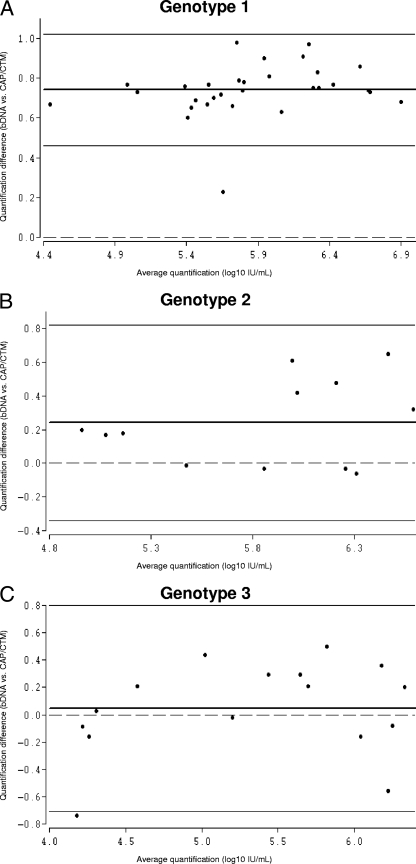
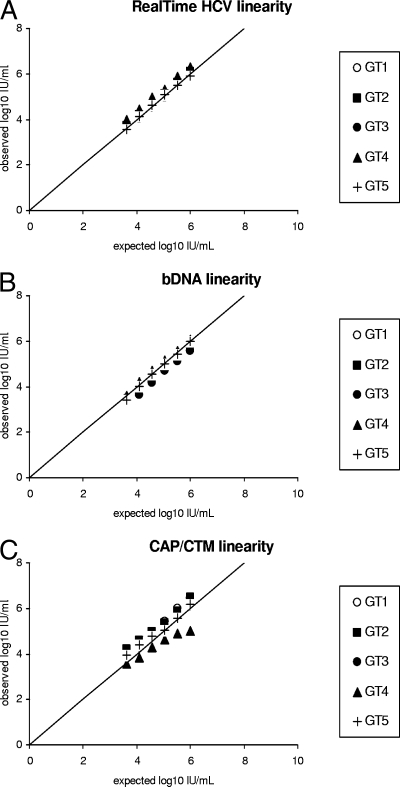
Hepatitis C virus (HCV) RNA detection and quantification are the key diagnostic tools for the management of hepatitis C. Commercially available HCV RNA assays are calibrated to the HCV genotype 1 (gt1)-based WHO standard. Significant differences between assays have been reported. However, it is unknown which assay matches the WHO standard best, and little is known about the sensitivity and linear quantification of the assays for non-gt1 specimens. Two real-time reverse transcriptase PCR-based assays (RealTime HCV and Cobas Ampliprep/Cobas TaqMan HCV [CAP/CTM]) and one signal amplification-based assay (the Versant HCV RNA, version 3.0, branched DNA [bDNA] assay) were compared for their abilities to quantify HCV RNA in clinical specimens (n = 65) harboring HCV isolates of gt1 to g5. The mean differences in the amounts detected by RealTime HCV in comparison to those detected by the bDNA assay and CAP/CTM were -0.02 and 0.72 log(10) IU/ml HCV RNA, respectively, for gt1; -0.22 and 0.03 log(10) IU/ml HCV RNA, respectively, for gt2; -0.27 and -0.22 log(10) IU/ml HCV RNA, respectively, for gt3; -0.19 and -1.27 log(10) IU/ml HCV RNA, respectively, for gt4; and -0.03 and 0.09 log(10) IU/ml HCV RNA, respectively, for gt5. The lower limits of detection for RealTime HCV and CAP/CTM were 16.8 and 10.3 IU/ml, respectively, for the WHO standard and in the range of 4.7 to 9.0 and 3.4 to 44.4 IU/ml, respectively, for clinical specimens harboring gt1 to gt6. Direct comparison of the two assays with samples of the WHO standard (code 96/798) with high titers yielded slightly smaller amounts by RealTime HCV (-0.2 log(10) at 1,500 IU/ml and -0.3 log(10) at 25,000 IU/ml) and larger amounts by CAP/CTM (0.3 log(10) at 1,500 IU/ml and 0.2 log(10) at 25,000 IU/ml). Finally, all three tests were linear between 4.0 x 10(3) and 1.0 x 10(6) IU/ml (correlation coefficient, >or=0.99). In conclusion, the real-time PCR based assays sensitively detected all genotypes and showed comparable linearities for the quantification of HCV RNA, with the exception of gt1 and gt4. The previously reported differences in the absolute quantification of samples harboring gt1 were confirmed and may be explained by different calibrations to the WHO standard.
Figures
Similar articles
-
Development of a second version of the Cobas AmpliPrep/Cobas TaqMan hepatitis C virus quantitative test with improved genotype inclusivity.J Clin Microbiol. 2011 Sep;49(9):3309-15. doi: 10.1128/JCM.00602-11. Epub 2011 Jul 13. J Clin Microbiol. 2011. PMID: 21752967 Free PMC article.
-
Comparison of conventional PCR with real-time PCR and branched DNA-based assays for hepatitis C virus RNA quantification and clinical significance for genotypes 1 to 5.J Clin Microbiol. 2006 Mar;44(3):729-37. doi: 10.1128/JCM.44.3.729-737.2006. J Clin Microbiol. 2006. PMID: 16517847 Free PMC article. Clinical Trial.
-
Performance evaluation of the new Roche cobas AmpliPrep/cobas TaqMan HCV test, version 2.0, for detection and quantification of hepatitis C virus RNA.J Clin Microbiol. 2013 Jan;51(1):238-42. doi: 10.1128/JCM.01729-12. Epub 2012 Nov 14. J Clin Microbiol. 2013. PMID: 23152551 Free PMC article.
-
Impact of hepatitis C virus (HCV) genotypes on quantification of HCV RNA in serum by COBAS AmpliPrep/COBAS TaqMan HCV test, Abbott HCV realtime assay [corrected] and VERSANT HCV RNA assay.J Clin Microbiol. 2007 Sep;45(9):3077-81. doi: 10.1128/JCM.00111-07. Epub 2007 Jun 20. J Clin Microbiol. 2007. PMID: 17581929 Free PMC article.
-
Evaluation of an automated, highly sensitive, real-time PCR-based assay (COBAS Ampliprep/COBAS TaqMan) for quantification of HCV RNA.J Clin Virol. 2008 Oct;43(2):162-8. doi: 10.1016/j.jcv.2008.06.013. Epub 2008 Aug 8. J Clin Virol. 2008. PMID: 18692434
Cited by
-
Clinical Laboratory Testing in the Era of Directly Acting Antiviral Therapies for Hepatitis C.Clin Microbiol Rev. 2017 Jan;30(1):23-42. doi: 10.1128/CMR.00037-16. Epub 2016 Oct 19. Clin Microbiol Rev. 2017. PMID: 27795306 Free PMC article. Review.
-
Role of HCV Viremia in Corroborated HCV Transmission Events Within Young Adult Injecting Partnerships.Open Forum Infect Dis. 2019 Apr 25;6(4):ofz125. doi: 10.1093/ofid/ofz125. eCollection 2019 Apr. Open Forum Infect Dis. 2019. PMID: 31041340 Free PMC article.
-
A novel diagnostic target in the hepatitis C virus genome.PLoS Med. 2009 Feb 10;6(2):e31. doi: 10.1371/journal.pmed.1000031. PLoS Med. 2009. PMID: 19209955 Free PMC article.
-
The future of viral hepatitis testing: innovations in testing technologies and approaches.BMC Infect Dis. 2017 Nov 1;17(Suppl 1):699. doi: 10.1186/s12879-017-2775-0. BMC Infect Dis. 2017. PMID: 29143676 Free PMC article. Review.
-
Future microfluidic and nanofluidic modular platforms for nucleic acid liquid biopsy in precision medicine.Biomicrofluidics. 2016 May 5;10(3):032902. doi: 10.1063/1.4948525. eCollection 2016 May. Biomicrofluidics. 2016. PMID: 27190565 Free PMC article. Review.
References
-
- Berg, T., V. Weich, G. Teuber, H. Klinker, B. Moeller, J. Rasenack, H. Hinrichsen, T. Gerlach, U. Spengler, P. Buggisch, H. Balk, M. Zankel, C. Sarrazin, S. Zeuzem, et al. 2007. Time to HCV RNA negativation in hepatitis C virus (HCV) type 1-infection during PEG-interferon-alpha-2B plus ribavirin therapy. Differences in relation to the assay sensitivity. Hepatology 46360A.
-
- Bland, J. M., and D. G. Altman. 1986. Statistical methods for assessing agreement between two methods of clinical measurement. Lancet i307-310. - PubMed
Publication types
MeSH terms
Substances
LinkOut - more resources
Full Text Sources
Medical
Miscellaneous
