Comparative Study
. 2008 Sep 18;3(9):e3234.
doi: 10.1371/journal.pone.0003234.

Comparative dynamics of retrograde actin flow and focal adhesions: formation of nascent adhesions triggers transition from fast to slow flow

Affiliations
Comparative Study

Comparative dynamics of retrograde actin flow and focal adhesions: formation of nascent adhesions triggers transition from fast to slow flow

Antonina Y Alexandrova et al. PLoS One. .

Abstract

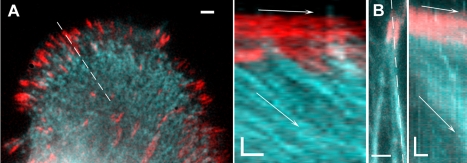
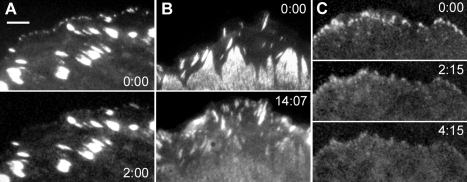
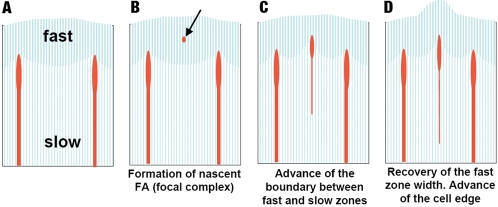
Dynamic actin network at the leading edge of the cell is linked to the extracellular matrix through focal adhesions (FAs), and at the same time it undergoes retrograde flow with different dynamics in two distinct zones: the lamellipodium (peripheral zone of fast flow), and the lamellum (zone of slow flow located between the lamellipodium and the cell body). Cell migration involves expansion of both the lamellipodium and the lamellum, as well as formation of new FAs, but it is largely unknown how the position of the boundary between the two flow zones is defined, and how FAs and actin flow mutually influence each other. We investigated dynamic relationship between focal adhesions and the boundary between the two flow zones in spreading cells. Nascent FAs first appeared in the lamellipodium. Within seconds after the formation of new FAs, the rate of actin flow decreased locally, and the lamellipodium/lamellum boundary advanced towards the new FAs. Blocking fast actin flow with cytochalasin D resulted in rapid dissolution of nascent FAs. In the absence of FAs (spreading on poly-L-lysine-coated surfaces) retrograde flow was uniform and the velocity transition was not observed. We conclude that formation of FAs depends on actin dynamics, and in its turn, affects the dynamics of actin flow by triggering transition from fast to slow flow. Extension of the cell edge thus proceeds through a cycle of lamellipodium protrusion, formation of new FAs, advance of the lamellum, and protrusion of the lamellipodium from the new base.


Conflict of interest statement

Competing Interests: The authors have declared that no competing interests exist.

Figures

Figure 1
Figure 1. Retrograde actin flow in spreading cells visualized by enhanced phase contrast and fluorescence microscopy.
Individual images of the time-lapse sequences are shown at the left, kymographs, at the right. Arrowheads indicate zones of fast flow (lamellipodia) , dashed lines on images indicate the regions used to generate kymographs, arrows in kymographs indicate the slope of the isointensity lines reflecting the velocity of flow. (A) Swiss 3T3 fibroblast at 1.5 h of spreading displays wide lamellipodium, which is distinguishable from the lamellum by its density and texture (left image) and the velocity of retrograde flow (see Supplementary Data, Movie S1A). Kymographs are generated along the phase-dense fiber (second from the left) and along the line between the fibers (second from right). The isointensity line in kymograph was traced manually (white line) and analyzed in Matlab to generate the plot of velocity versus distance from the edge of the cell (right), which shows an abrupt change of velocity from approximately 6.2 µm/min to 2.4 µm/min at the lamellipodium/lamellum boundary. (B) REF-52 fibroblast at 5 h of spreading injected with rhodamine-actin and visualized with double mode microscopy: phase contrast (left) and fluorescence (second from left). The lamellipodium is distiguishable from the lamellum by its high actin concentration and the density and texture in the phase contrast images. The width of the lamellipodium in late spreading was smaller than in recently plated cells (compare with A). Small fibers in the lamellum are apparent in both fluorescence and phase contrast images. Kymographs generated from the phase contrast (second from right) and fluorescence (right) image sequences show identical flow velocities (0.8 µm/min in the lamellipodium, and 0.06 µm/min in the lamellum). See also Supplementary Data, Movie S1B. (C) Spreading B16 melanoma cell expressing GFP-actin imaged in double phase contast/fluorescence mode and analyzed with kymographs as in (B). Dashed line marked “CD” on kymograph indicates the time of addition of cytochalasin D (2 µM). Addition of cytochalasin D resulted in the immediate arrest of spreading and the decrease of the velocity of the lamellipodial flow (from 2.6 µm/min to 0.4 µm/min), which thus became equal to the velocity of the lamellar flow. (D) Enhanced phase contrast image (left) and kymograph (right) of spreading Swiss 3T3 cell. Dashed line on kymograph indicate the time of addition of 30 µM HA1077, which results in the decrease of velocity of the lamellar flow (from 1 to 0.4 µm/min) with no change in the lamellipodial flow (4.5 µm/min). Scale bars on images, 5 µm; on kymographs, vertical bars, 2 µm, horizontal bars, 2 min.
Figure 2
Figure 2. FAs define the boundary between fast and slow flow.
(A) Superimposition of the enhanced phase contrast and fluorescence images (left) and kymographs (right) of spreading REF-52 cell expressing YFP-paxillin. Phase contrast image is represented in gray scale, and YFP-paxillin fluorescence image, in red. FAs marked by YFP-paxillin coincide with the boundary between the lamellipodium and the lamellum (see also Supplementary Data, Movie S2A). Kymographs (phase contrast on top, fluorescence in the middle, and merge at the bottom) demonstrate that the fast flow did not penetrate behind the FAs and that the zone of slow flow advanced concomitantly with the formation of new FA. Arrows on kymographs are drawn parallel to isointensity lines indicating the velocity of fast flow (4.5 µm/min), slow flow (0.5 µm/min), and the velocity of the sliding of FAs (0.15 µm/min). (B, C) Selected frames from the time-lapse sequence showing two instances of the formation of the new FAs and associated dynamics of the boundary between the two flow zones; time is indicated in minutes:seconds. Sequence (B) represents dynamics of the region boxed in (A). New FAs (paxillin-positive spots indicated with arrowheads) form within the lamellipodia at 30 s in (B), and 20 s in (C). Disturbance of the flow is simultaneously seen in the phase contrast image as a dark zone in front of the FA. Formation of FAs is followed next by the advance of the lamellum (dark boundary between the lamellipodium and the lamellum is visible in the phase contrast mode). In (B) the lamellipodium persists throughout the sequence, while in (C) formation of the new FA is followed by the ruffling and withdrawal and then re-growth of the lamellipodium. See Supplementary Data, Movies S2B and S2C. (D) REF-52 cells were plated in the serum-free media onto the coverslips coated with poly-L-lysine (1 h with 10 mg/ml aqueous solution), kymograph generated along the dashed line at the left is shown at the right. Kymograph demonstrates uniform flow velocity (1.6 µm/min) throughout the spread part of the cell. See also Supplementary Data, Movie S2D. Scale bars, 5 µm; in kymographs vertical bars, 2 µm, horizontal bars, 2 min.
Figure 3
Figure 3. Flow of the components of stress-fibers with respect to FAs.
(A) Double fluorescence image (left) and kymograph (right) of YFP-paxillin (red) and rhodamine-myosin II (cyan) in REF-52 cell. Myosin flow velocity is 1 µm/min, FAs move at 0.05 µm/min (arrows). See Supplementary Data, Movie S3A. (B) Double fluorescent image (left) and kymograph (right) of YFP-paxillin (red) and GFP-actin (cyan) in REF-52 cell. Actin flow velocity in the stress fiber is 0.75 µm/min, FAs move at 0,12 µm/min (arrows). See Supplementary Data, Movie S3B. Scale bars, 2 µm; in kymographs vertical bars, 2 µm, horizontal bars, 2 min.
Figure 4
Figure 4. Effect of the inhibitors of retrograde flow on FAs.
FAs were visualized with YFP-paxillin. FA distribution is shown just before (top panels in A–C), and after the addition of the inhibitor (bottom panels in A–C, and middle panel in C), time after the addition is indicated in minutes. (A) Cytochalasin D treatments (2 µM) abolished small nascent adhesions; (B) H7 treatment (30 µM) abolished large mature adhesions and increased the number of small adhesions; (C) cytochalasin D treatment of the cells preincubated for 1 h with H7 abolished small adhesions which were present after treatment with H7. Bar, 5 µm.
Figure 5
Figure 5. Diagram of the multi-step protrusion process at the leading edge of the cell.
Fast and slow flow zones are shown with different shading; nascent and mature FAs are shown as ellipses of different sizes; and stress fibers are shown as sticks. Formation of nascent FAs within the fast flow zone locally interferes with flow, and eventually results in the advance of the boundary between the fast and slow flow zones. Therefore, the width of the slow flow zone (the lamellum) increases, while the width of the fast flow zone (the lamellipodium) decreases. Subsequently, the lamellipodium re-establishes its width, resulting in the overall advance of the cell edge.

References

    1. Ridley AJ, Schwartz MA, Burridge K, Firtel RA, Ginsberg MH, et al. Cell migration: integrating signals from front to back. Science. 2003;302:1704–1709. - PubMed
    1. Mogilner A, Oster G. Polymer motors: pushing out the front and pulling up the back. Curr Biol. 2003;13:R721–733. - PubMed
    1. Geiger B, Bershadsky A, Pankov R, Yamada KM. Transmembrane extracellular matrix–cytoskeleton crosstalk. Nat Rev Mol Cell Biol. 2001;2:793–805. - PubMed
    1. Kaverina I, Krylyshkina O, Small JV. Regulation of substrate adhesion dynamics during cell motility. Int J Biochem Cell Biol. 2002;34:746–761. - PubMed
    1. Webb DJ, Brown CM, Horwitz AF. Illuminating adhesion complexes in migrating cells: moving toward a bright future. Curr Opin Cell Biol. 2003;15:614–620. - PubMed

Publication types