

Review
doi: 10.1021/cr0782473.
Epub 2008 Sep 19.
Cell culture systems for studies of bone and tooth mineralization
Affiliations
- PMID: 18800815
- PMCID: PMC2653100
- DOI: 10.1021/cr0782473
Item in Clipboard
Review
Cell culture systems for studies of bone and tooth mineralization
Chem Rev.
2008 Nov.
No abstract available
Figures
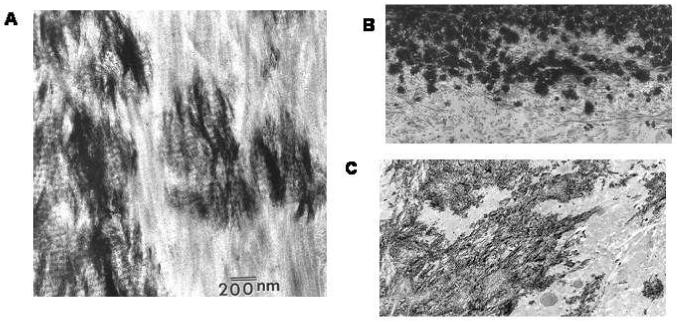
Transmission electron microscopy (TEM) reveals the orientation of the mineral crystals relative to collagen fibrils. A) High resolution image of a bone specimen. Note the electron dense mineral is aligned parallel to the collagen fibrils. B) Lower resolution image of an osteoblast culture, mineralized in the presence of 5 mM BGP, clumps of mineral crystals are associated with the collagen fibrils, but the crystals do not appear to be aligned. C) Low resolution image of a differentiating mesenchymal cell micro-mass culture at 23 days shows the electron dense mineral associated with collagen fibrils; because the cells are chondrocytes, they make type II collagen, yet the mineral is associated with the collagen fibrils. (Photomicrographs were provided from Dr. S. B. Doty, Hospital for Special Surgery, New York, NY).
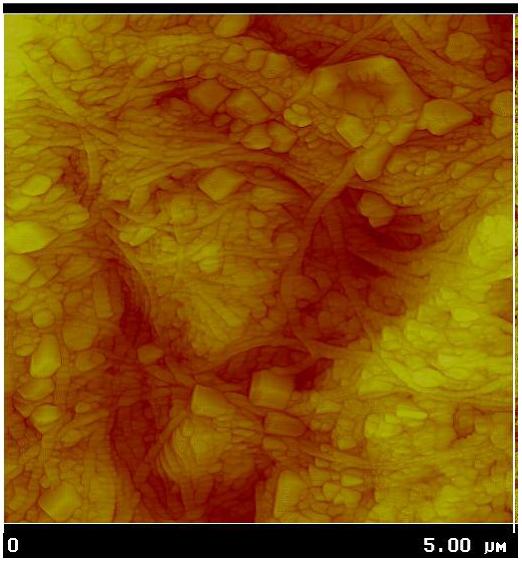
Atomic Force Microscopy (AFM) of mineral in culture. AFM height map of MLO-A5 osteocytes at 12 days in culture showing multiple spherical structures intercalated between collagen fibers. MLO-A5 cell culture figure provided by Dr. Cielo Barragan-Adjemian and Dr. Lynda Bonewald UMKC, Kansas City, MO and analyzed with AFM by Dr. Dan Nicollela Southwest Institute, San Antonio, TX. For detailed of the mineral-containing spherical structures see reference .
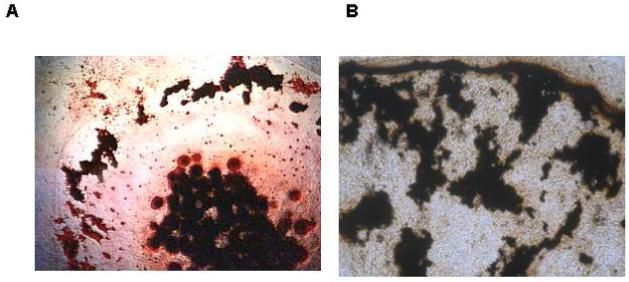
Histochemical analysis of mineral formed in chondrocyte micro-mass cultures using the silver-stain (von Kossa) technique. A) Primary chick limb-bud mesenchymal cells that differentiated into chondrocytes shown at day 24. Micro-mass cultures were maintained in DMEM containing 10% fetal bovine serum with 4mM inorganic phosphate, 50 ug/ml ascorbate, and antibiotics. B) ATDC5 cells maintained in culture for 35 days in the presence of the same additives plus 100 ng/ml BMP-2. Cultures counter stained with neutral Red. Black deposits in the center of the culture dish and around the periphery are the von Kossa positive material.
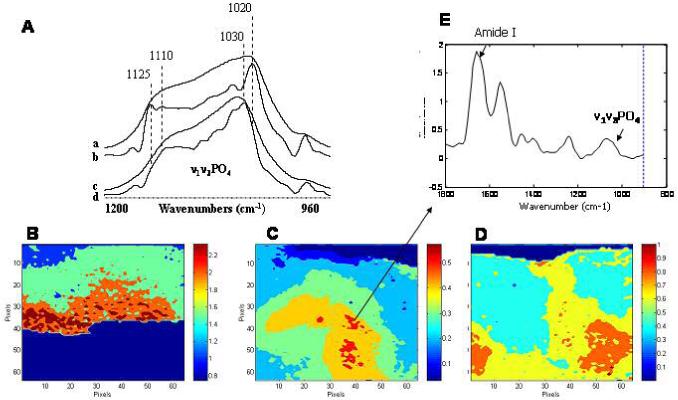
Fourier Transform Infrared Analysis of mineral formed in culture. Infrared spectroscopy can be used to characterize the mineral formed in culture. A) The phosphate absorption band observed in the odontoblast M2H4 cell line maintained in culture for days 8-21 with 10 ng TGFbeta 1, 100 ng/ml BMP-4, and 3 mM inorganic phosphate (a), when deconvoluted to reveal underlying peaks (b), resembles that obtained from a dentin slice (c) and its deconvoluted spectrum (d). The subbands at 1125 and 1020 cm-1 are characteristic of an immature hydroxyapatite rich in acid phosphate and carbonate substituents. Generously provided by Professor J. Guicheux and D. Magne. Details of the culture system are in reference . B) By attaching an array detector to the infrared microscope, images corresponding to each of the parameters of interest can be obtained. FTIR spectroscopic imaging of the mineral/matrix ratio in a mineralizing chick limb-bud micromass culture at day 21 showing the distribution of mineral. These cells were maintained in DMEM with 1.4 mM calcium and 4 mM inorganic phosphate plus antibiotics and 40 uM ascorbate. C) FTIR spectroscopic image of the mineral/matrix ratio in a “bone nodule” formed in an osteoblast culture at day 14. The cells were cultured with alpha -MEM containing ascorbate, vitamin D, and a total of 3 mM inorganic phosphate. Note the mineral/matrix ratio in the day 21 chondrocytes is higher than thatin the 14 D osteoblast culture. D) Image showing the distribution of crystal size (and perfection (in the culture illustrated in figure C. E) Spectrum corresponding to the pixel indicate in C is shown in figure 3. The amide I and phosphate bands are noted.
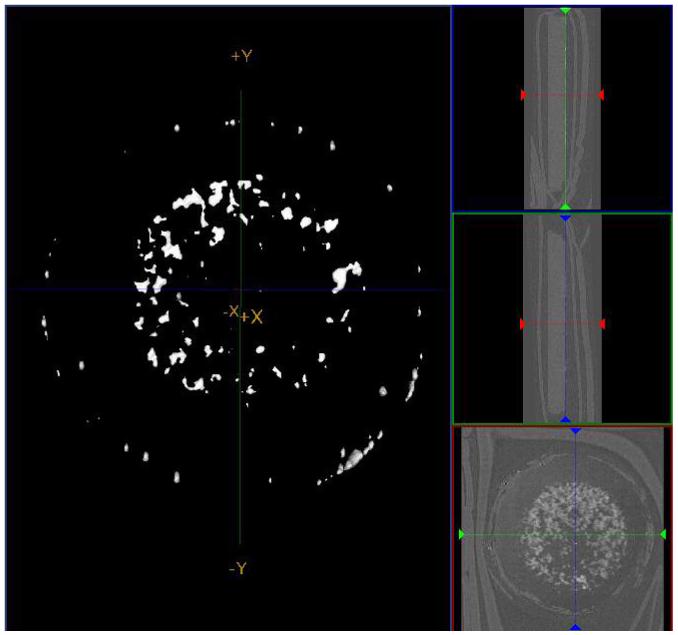
Micro-computed tomography (microCT) shows the increased density due to the mineral deposited in C3H10T1/2 cells grown in micro-mass culture at 35 days. These cultures were supplemented with ITS, 1% fetal bovine serum, ascorbate, and 4 mM phosphate. Figures on the right show lateral and bottom views of the dish and culture.
References
-
- McCauley LK. Curr. Opin. Rheumatol. 2001;13:316. - PubMed
-
- Thyagarajan T, Totey S, Danton MJ, Kulkarni AB. Crit. Rev. Oral Biol. Med. 2003;14:154. - PubMed
-
- Kimelman N, Pelled G, Helm GA, Huard J, Schwarz EM, Gazit D. Tissue Eng. 2007;13:1135. - PubMed
-
- Langer R, Vacanti JP. Science. 1993;260:920. - PubMed
-
- Barkana I, Alexopoulou E, Ziv S, Jacob-Hirsch J, Amariglio N, Pitaru S, Vardimon AD, Nemcovsky CE. J. Clin. Periodontol. 2007;34:599. - PubMed
Publication types
MeSH terms
Substances
Grants and funding
LinkOut - more resources
Full Text Sources
Other Literature Sources
Medical
