. 2009 Jan;150(1):24-32.
doi: 10.1210/en.2008-0742. Epub 2008 Sep 18.

Tissue-specific difference in the molecular mechanisms for the development of acute insulin resistance after injury

Affiliations

Tissue-specific difference in the molecular mechanisms for the development of acute insulin resistance after injury

Li Li et al. Endocrinology. 2009 Jan.

Abstract

Acute insulin resistance occurs after injury, hemorrhage, infection, and critical illness. However, little is known about the development of this acute insulin-resistant state. In the current study, we found that insulin resistance develops rapidly in skeletal muscle, with the earliest insulin signaling defects at 60 min. However, defects in insulin signaling were measurable even earlier in liver, by as soon as 15 min after hemorrhage. To begin to understand the mechanisms for the development of acute insulin resistance, serine phosphorylation of insulin receptor substrate (IRS)-1 and c-Jun N-terminal kinase phosphorylation/activation was investigated. These markers (and possible contributors) of insulin resistance were increased in the liver after hemorrhage but not measurable in skeletal muscle. Because glucocorticoids are important counterregulatory hormones responsible for glucose homeostasis, a glucocorticoid synthesis inhibitor, metyrapone, and a glucocorticoid receptor antagonist, RU486, were administered to adult rats prior to hemorrhage. In the liver, the defects of insulin signaling after hemorrhage, including reduced tyrosine phosphorylation of the insulin receptor and IRS-1, association between IRS-1 and phosphatidylinositol 3-kinase and serine phosphorylation of Akt in response to insulin were not altered by pretreatment of rats with metyrapone or RU486. In contrast, hemorrhage-induced defects in insulin signaling were dramatically reversed in skeletal muscle, indicating a prevention of insulin resistance in muscle. These results suggest that distinct mechanisms for hemorrhage-induced acute insulin resistance are present in these two tissues and that glucocorticoids are involved in the rapid development of insulin resistance in skeletal muscle, but not in the liver, after hemorrhage.


Figures

Figure 1
Figure 1
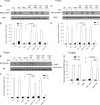
Decreased insulin signaling via phospho-Akt (P-Akt) at multiple time points after trauma and hemorrhage in the liver and triceps. Rats were subjected to T or TH. At 0′, 15′, 30′, 60′, and 90′ (with or without hemorrhage) either saline (−) or 5 U insulin (Ins; +) was injected via the portal vein. The liver and triceps were removed after 1 min. Tissue lysates were subjected to Western blotting with antibodies specific for PS473-Akt. Representative Western blots from TH0′, TH15′, TH30′, TH60′, and TH90′ in liver (A) and triceps (C) are presented. B and D, Autoradiographs from TH30′, TH60′, and TH90′ were quantified by scanning densitometry. The data are presented as mean ± sem fold change of PS473-Akt by insulin of three rats in each group. The phosphorylated protein levels in T0′ without insulin treatment were arbitrarily set to 1. ^, P < 0.01, compared with T-only group at the same time point with insulin injection; $, P < 0.01, compared with T0′ with insulin injection.
Figure 2
Figure 2
Decreased insulin-induced tyrosine phosphorylation of IRS-1 and IR in the liver and triceps after TH. At the same time points and treatments described in Fig. 1, liver and triceps were removed after either saline (−) or 5 U insulin injection. A and B, Representative Western blots from TH30′ and TH60′ are presented. C, Time-dependent decrease in insulin responses in the liver and triceps after hemorrhage. There were three rats in each group. Ins, Insulin.
Figure 3
Figure 3
Comparison of PS IRS-1 and JNK activation in the liver and triceps. At T0′, TH60′, and TH60′ with metyrapone treatment, the liver and triceps were removed and subjected to Western blot analysis. The blots were probed with specific anti-PS312-IRS-1, total IRS-1, anti-P-JNK1/2, and total JNK antibodies. Representative Western blots are presented (T0′-ins and TH60′-ins, three rats each; TH60′-ins+Met, five rats;). Ins, Insulin; Met, metyrapone.
Figure 4
Figure 4
Plasma FFA (A) and corticosterone (B) levels in differently treated rats. Metyrapone, RU486, or vehicle was administered as described in Materials and Methods. The rats were killed at the end of surgery at which time blood was collected for the determination of plasma FFA and corticosterone levels. Results are expressed as milliequivalents per liter plasma and nanograms corticosterone per milliliter plasma, respectively. Each value represents the mean ± se of six to 10 rats per group (T0′, six rats; normal, six rats; T60′, six rats; TH60′, six rats; T60′+Met, six rats; TH60′+Met, 10 rats; T60′+veh, six rats; TH60′+veh, six rats; TH60′+RU486, nine rats). Met, Metyrapone; Veh, vehicle; NS, not significant.
Figure 5
Figure 5
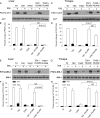
Insulin-induced phosphorylation of Akt, tyrosine phosphorylation of IRS-1, and IR autophosphorylation were not increased by metyrapone treatment in liver. Rats were subjected to T or TH. Metyrapone (150 mg/kg, sc) or vehicle was administered as described. At the end of surgery, either saline (−) or 5 U insulin was injected via the portal vein. Tissue lysates were subjected to Western blotting with antibodies specific for PS473-Akt or total Akt, PY-IRS-1 or total IRS-1, and PY-IR or total IR. Representative Western blots are presented in A, C, and E. B, D, F, and G, Autoradiographs were quantified by scanning densitometry and the data are presented as the mean ± se of three to five rats in each group (five rats in TH60′+ins+Met group, five rats in TH60′-ins+Met group, three rats in other groups). The phosphorylated protein levels in T0′ with insulin injection were arbitrarily set to 100%. A–F, T60′/TH60′; G, T90′/TH90′. Met, Metyrapone; Veh, vehicle; Ins, insulin; NS, not significant.
Figure 6
Figure 6
Effects of metyrapone on the impaired insulin signaling pathway in triceps. At the same time points and treatment described in Fig. 5, either saline (−) or 5 U insulin was injected into the portal vein, and 1 min later triceps was removed. Then 30 μg protein extracted from triceps were subjected to Western blot analysis by specific antibodies as described in Fig. 5. A, C, and E, Representative Western blots are presented. B, D, F, and G, Bars represent mean ± se from three to five rats in each group (five rats in TH60′+ins+Met group, five rats in TH60′-ins+Met group, three rats in other groups). A–F, T60′/TH60′; G, T90′/TH90′. Met, Metyrapone; Veh, vehicle; Ins, insulin; NS, not significant.
Figure 7
Figure 7
Effects of metyrapone on the association between IRS-1 and PI3K in the liver and triceps. At the same time points and treatment regimens described in Fig. 5, the liver and triceps were removed and protein extracts were immunoprecipitated with specific total IRS-1 antibody and then subjected to Western blot analysis by specific total IRS-1 and anti-PI3K-p85 subunit antibodies. A and B, Representative blots are presented, respectively, from the liver and triceps (six rats each in the T0′, T60′, TH60′, and TH60′+veh groups, and 10 rats in the TH60′+Met group). IP, Immunoprecipitation; IB, immunoblot; Met, metyrapone; Veh, vehicle; Ins, insulin.
Figure 8
Figure 8
The inhibition of glucocorticoid receptor can increase Akt and IRS-1 phosphorylation in triceps but not the liver. RU486, a glucocorticoid receptor antagonist, was administered as described in Materials and Methods. Liver and triceps tissue lysates were subjected to Western blotting with specific anti-PS473-Akt and anti-PY612-IRS-1 antibodies. Representative blots are presented in A, C, E, and G. B, D, F, and H, Bars represent mean ± se from three to five rats in each group (five rats in TH60′+ins+RU486 group, four rats in TH60′-ins+RU486 group, three rats in other groups). Ins, Insulin; NS, not significant.

Similar articles

Cited by

References

    1. Desouza C, Gilling L, Fonseca V 2001 Management of the insulin resistance syndrome. Curr Diab Rep 1:140–147 - PubMed
    1. Kendall DM, Harmel AP 2002 The metabolic syndrome, type 2 diabetes, and cardiovascular disease: understanding the role of insulin resistance. Am J Manag Care 8:S635–S653 - PubMed
    1. Ikezu T, Okamoto T, Yonezawa K, Tompkins RG, Martyn JA 1997 Analysis of thermal injury-induced insulin resistance in rodents. Implication of postreceptor mechanisms. J Biol Chem 272:25289–25295 - PubMed
    1. Carter EA 1998 Insulin resistance in burns and trauma. Nutr Rev 56:S170–S176 - PubMed
    1. Lange MP, Dahn MS, Jacobs LA 1985 The significance of hyperglycemia after injury. Heart Lung 14:470–472 - PubMed

Publication types