. 2008 Dec 1;112(12):4574-84.
doi: 10.1182/blood-2008-04-148692. Epub 2008 Sep 18.

Estrogen inhibits dendritic cell maturation to RNA viruses

Affiliations

Estrogen inhibits dendritic cell maturation to RNA viruses

Maria M Escribese et al. Blood. .

Abstract

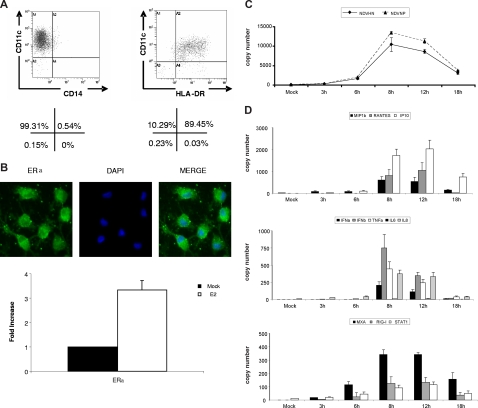
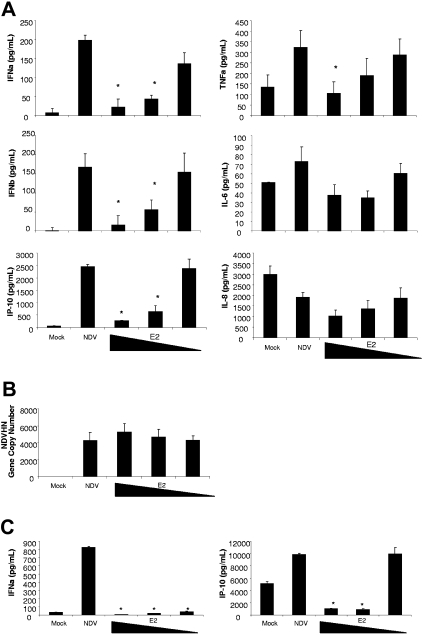
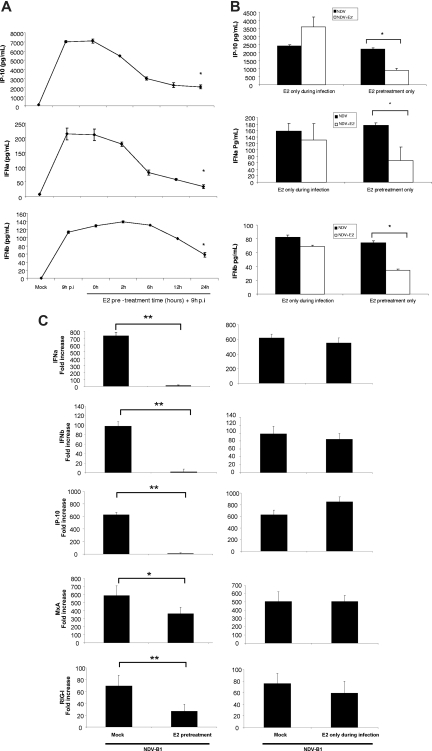
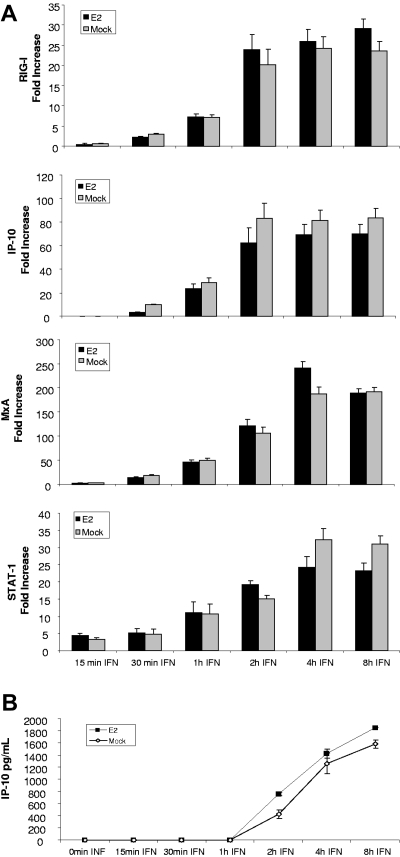
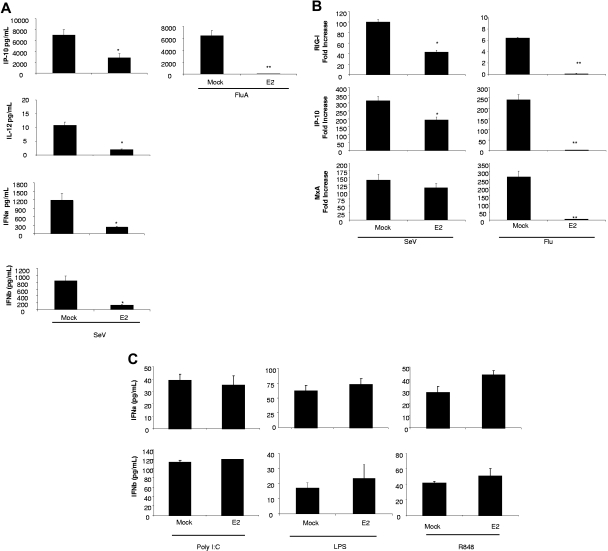
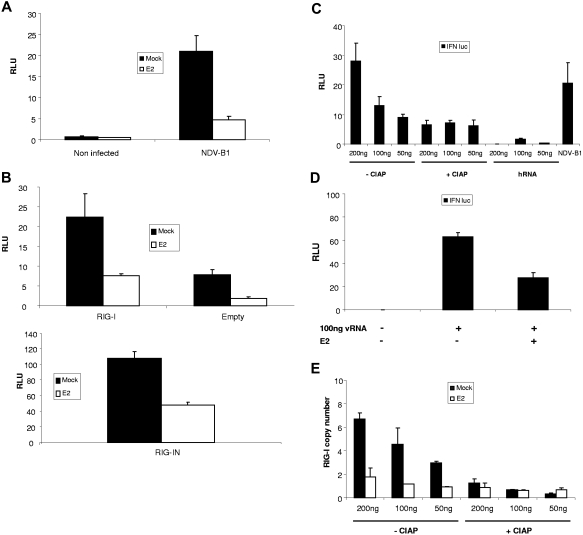
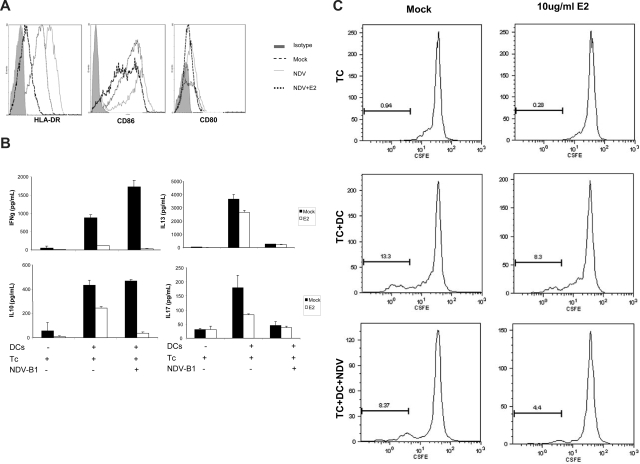
Dendritic cells (DCs) play a central role in initiating and polarizing the immune response. Therefore, DC maturation represents a key control point in the shift from innate to adaptive immunity. It is suspected that during pregnancy, hormones are critical factors that modulate changes reported to occur in maternal immunity. Here we examined the effect of 17-beta-estradiol (E2) on the maturational response triggered by virus in human DCs and its influence on their ability to activate naive T cells. We developed an in vitro system to measure the response of DCs to virus infection with Newcastle disease virus (NDV) after a 24-hour E2 treatment. Using this system, we demonstrated that E2 pretreatment down-regulated the antiviral response to RNA viruses in DCs by profoundly suppressing type I interferon (IFN) synthesis and other important inflammatory products. In addition, the DCs capacity to stimulate naive CD4 T cells was also reduced. These results suggest an important role for E2 in suppressing the antiviral response and provide a mechanism for the reduced immunity to virus infection observed during pregnancy.


Figures

Figure 1
Figure 1
NDV-B1 infection induced strong response in dendritic cells. CD14+ cells isolated from fresh blood were cultured for 5 days in the presence of IL-4 and GM-CSF to differentiate into dendritic cells (DCs). (A) Monocyte-derived DCs expressed a classic DC profile: CD11c+ HLADR+ CD14. Percentages are representative of 5 independent experiments. (B) 40× original magnification of ERα immunofluorescence in immature DCs (top panel). Levels of ERα mRNA measure by RT-PCR in mock-treated cells and with 24-hour E2 treatment (bottom panel). Data are presented as fold increase over mock treated, mean plus or minus SD, and results are representative of 3 independent experiments. (C) Viral proteins (NDV HN and NDV NP) measured by qRT-PCR in DCs after 0, 3, 6, 8, 12, and 18 hours of NDV-B1 infection. Data are representative of 3 independent experiments. (D) Cytokines, chemokines, and viral gene expression in DCs after 0, 3, 6,8,12, and 18 hours of NDV-B1 infection measured by qRT-PCR. Results are representative of 3 independent experiments.
Figure 2
Figure 2
E2 suppresses the antiviral response induced by NDV-B1 in DCs. (A) Measurement of cytokines in supernatants from DCs pretreated for 24 hours with E2 (10, 1, 0.1 g/mL) and infected for 9 hours with NDV-B1 (MOI 0.5) in the continued presence of E2. Data are presented as mean plus or minus SD of triplicate samples from 5 independent experiments.*P < .001 versus NDV-B1–infected DCs. (B) NDV-B1 replication after 9 hours of infection was measured in all the experimental conditions by NDVHN gene expression (qRT-PCR). Data are presented as mean plus or minus SD from 3 independent experiments. (C) ELISA of myeloid DC supernatants, directly isolated from fresh blood pretreated for 24 hours with E2 (10, 1, 0.1 μg/mL) and infected with NDV-B1 (MOI 0.5) for 9 hours in the continued presence of E2. Data are presented as mean plus or minus SD from 3 independent experiments.*P < .001 versus NDV-B1–infected myeloid DCs.
Figure 3
Figure 3
E2 pretreatment is necessary for the antiviral response down-regulation in DCs. (A) Measurement of IFNα/β and IP-10 levels by ELISA. E2 (10 μg/mL) pretreatment kinetic (0, 2, 6, 12, 24 hours) of DCs later infected for 9 hours with NDV-B1 in the presence of E2. Data are presented as mean plus or minus SD from 4 independent experiments. *P < .05 versus NDV-B1–infected DCs. (B) Measurement of IFNα/β and IP-10 by ELISA. DCs pretreated with 10 μg/mL E2 and infected for 9 hours without E2 in the medium (E2 pretreatment only) or DCs with no E2 pretreatment but infected in the presence of E2 for 9 hours with NDV-B1 (E2 only during infection). Data are presented as mean plus or minus SD from 4 independent experiments. *P < .05 versus NDV-B1–infected cells. (C) Type I IFN and IFN-responsive gene expression measured by qRT-PCR. DCs pretreated for 24 hours and infected for 9 hours with NDV-B1 in the presence of E2 (E2 pretreatment) and DCs without E2 pretreatment infected with NDV-B1 in the presence of E2 (E2 only during infection). Data are presented as mean plus or minus SD from 4 independent experiments. **P < .001 or *P < .05 versus NDV-B1–infected DCs.
Figure 4
Figure 4
E2 did not modify the signaling induced by IFNβ. (A) Expression of genes involved in type I IFN signaling and IFN-inducible genes measured by qRT-PCR in DCs pretreated for 24 hours with E2 and treated for 15 minutes, 30 minutes, 1 hour, 2 hours, 4 hours, and 8 hours with 5000 U/mL IFNβ. Data are presented as mean plus or minus SD of 4 independent experiments. (B) IP-10 expression measure by ELISA in DCs pretreated for 24 hours with E2 and treated for 15 minutes, 30 minutes, 1 hour, 2 hours, 4 hours, and 8 hours with 5000 U/mL IFNβ. Data are presented as mean plus or minus SD from 4 independent experiments.
Figure 5
Figure 5
E2 down-regulates the antiviral response induced by RNA viruses but not by TLR agonist. (A) Cytokine levels measures by ELISA from DCs pretreated for 24 hours with 10 μg/mL E2 and infected with Influenza A (Flu) or SeV at an MOI of 0.5 for 9 hours. Data are presented as mean plus or minus SD from 4 independent experiments.*P < .05 or **P < .001 versus infected DCs. (B) RIG-I, IP-10, and MxA levels measured by qRT-PCR from DCs pretreated for 24 hours with 10 μg/mL E2 and infected with Influenza A (Flu) or SeV at an MOI of 0.5 for 9 hours. Data are presented as mean plus or minus SD from 4 independent experiments. *P < .05 or **P < .001 versus infected DCs. (C) Cytokine levels measured by ELISA from DCs pretreated for 24 hours with 10 μg/mL E2 before TLR 3, 4, and 7/8 activation.
Figure 6
Figure 6
E2 inhibit DC maturation triggered by 5′ triphosphate viral RNA. MCF-7 cells were transfected with IFNβ promoter reporter construct driving firefly luciferase(A) alone or (B) along with a plasmid expressing RIG-I (top panel), RIG IN (bottom panel), or an empty plasmid. Cells were then pretreated or not with 10 μg/mL E2 and 24 hours later and infected with NDV-B1 (MOI = 0.5) for 6 to 8 hours (top panel) or just pretreated for 24 hours with E2 (bottom panel). The Relative Luciferase Units (RLUs) were measured 6 to 8 hours after NDV-B1 infection and RIG-IN transfection, respectively. (C) Cells were cotransfected with NDV genomic RNA (50 ng, 100 ng, 200 ng), treated or not with CIAP, or transected with irrelevant human mRNA (50 ng, 100 ng, 200 ng) along with IFNβ promoter reporter. As a control for the activation of the IFNβ promoter, cells were also infected with NDV-B1 for 6 hours. Cells pretreated or not with E2 were: (D) cotransfected with 100 ng viral RNA along with IFNβ promoter reporter for 6 to 8 hours or (E) transfected with viral RNA (50, 100, 200 ng) treated or not treated with CIAP. RIG-I expression was measured by RTqPCR 6 hours after infection. Results are presented as mean plus or minus SD and are representative of 3 experiments.
Figure 7
Figure 7
E2 reduces T-cell priming by DCs. (A) Costimulatory molecule expression (HLADR, CD86, and CD80) measured by FACS. DCs were mock treated, infected with NDV-B1, or pretreated for 24 hours with E2 before infection. Results are representative of 3 independent experiments. (B) DCs treated or not for 24 hours with 10 μg/mL E2 were infected for 1 hour with NDV-B1 at an MOI of 0.5. Afterward, DCs were incubated with naive CD4 T cells from an allogeneic donor at a ratio of 1:5 for 5 to 6 days. Supernatants were harvested and tested by ELISA for the release of IFN-γ, IL-10, IL-13, and IL-17. Data presented as mean plus or minus SD and are representative of 2 independent experiments. (C) Naive CD4 T cells labeled with CSFE (2.5 μM) were incubated with DCs infected or mock infected in the presence or absence of E2 for 5 to 6 days. Naive CD4 T-cell proliferation was measured by FACS. Results were representative of 2 independent experiments.

Similar articles

Cited by

References

    1. van Duivenvoorde LM, van Mierlo GJ, Boonman ZF, Toes RE. Dendritic cells: vehicles for tolerance induction and prevention of autoimmune diseases. Immunobiology. 2006;211:627–632. - PubMed
    1. Granucci F, Zanoni I, Feau S, Capuano G, Ricciardi-Castagnoli P. The regulatory role of dendritic cells in the immune response. Int Arch Allergy Immunol. 2004;134:179–185. - PubMed
    1. Wang RF, Miyahara Y, Wang HY. Toll-like receptors and immune regulation: implications for cancer therapy. Oncogene. 2008;27:181–189. - PubMed
    1. Kumagai Y, Takeuchi O, Kato H, et al. Alveolar macrophages are the primary interferon-alpha producer in pulmonary infection with RNA viruses. Immunity. 2007;27:240–252. - PubMed
    1. Yoneyama M, Kikuchi M, Matsumoto K, et al. Shared and unique functions of the DExD/H-box helicases RIG-I, MDA5, and LGP2 in antiviral innate immunity. J Immunol. 2005;175:2851–2858. - PubMed

Publication types

MeSH terms