. 2008 Oct 24;103(9):983-91.
doi: 10.1161/CIRCRESAHA.108.178970. Epub 2008 Sep 18.

Glycogen synthase kinase 3 inhibition slows mitochondrial adenine nucleotide transport and regulates voltage-dependent anion channel phosphorylation

Affiliations

Glycogen synthase kinase 3 inhibition slows mitochondrial adenine nucleotide transport and regulates voltage-dependent anion channel phosphorylation

Samarjit Das et al. Circ Res. .

Abstract

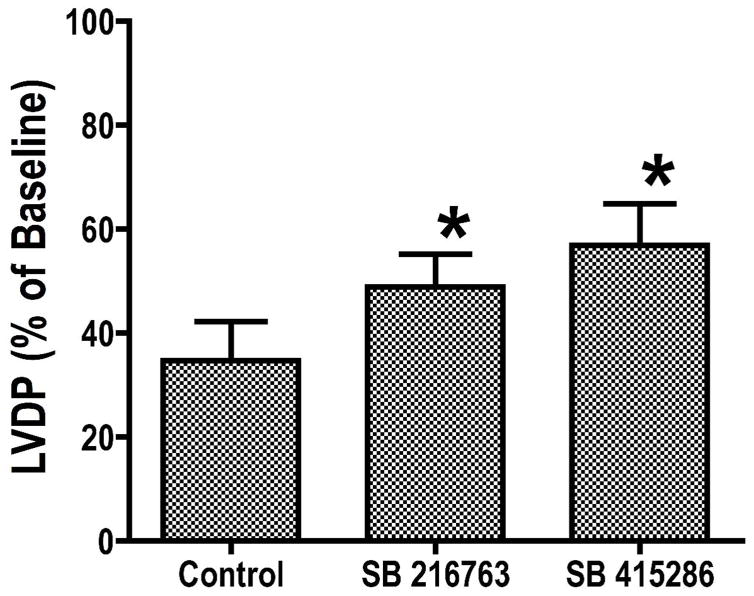
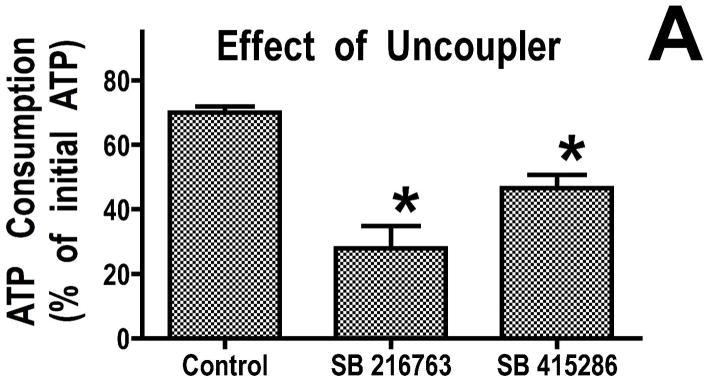
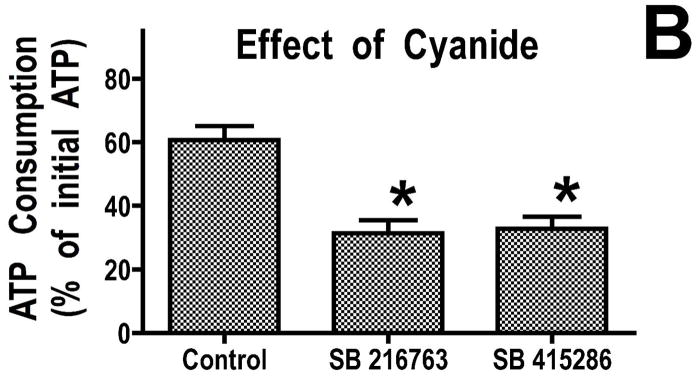
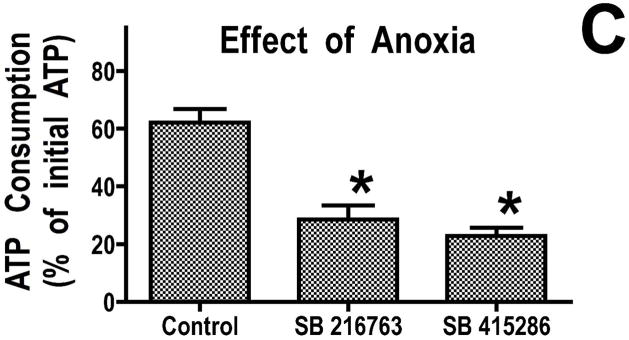
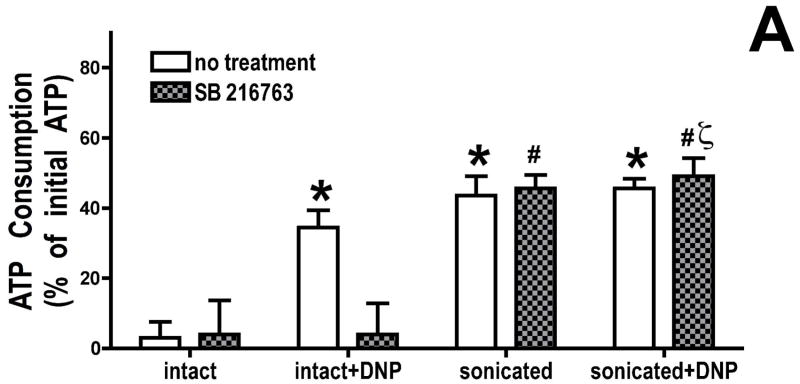
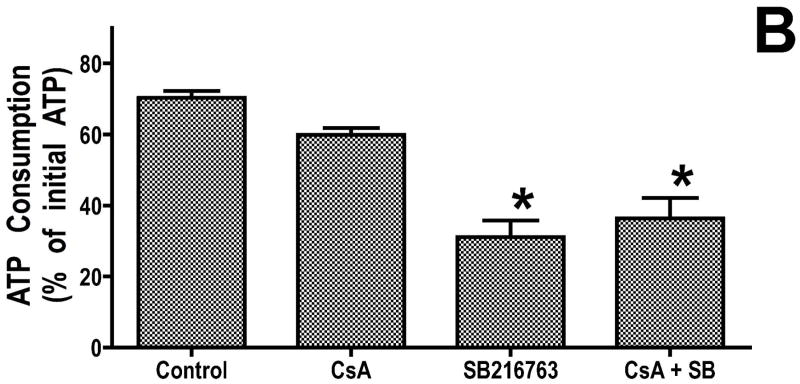
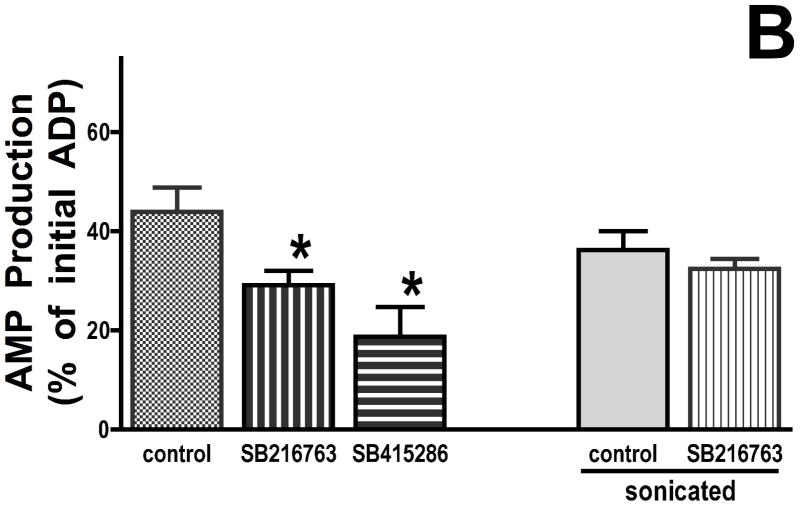
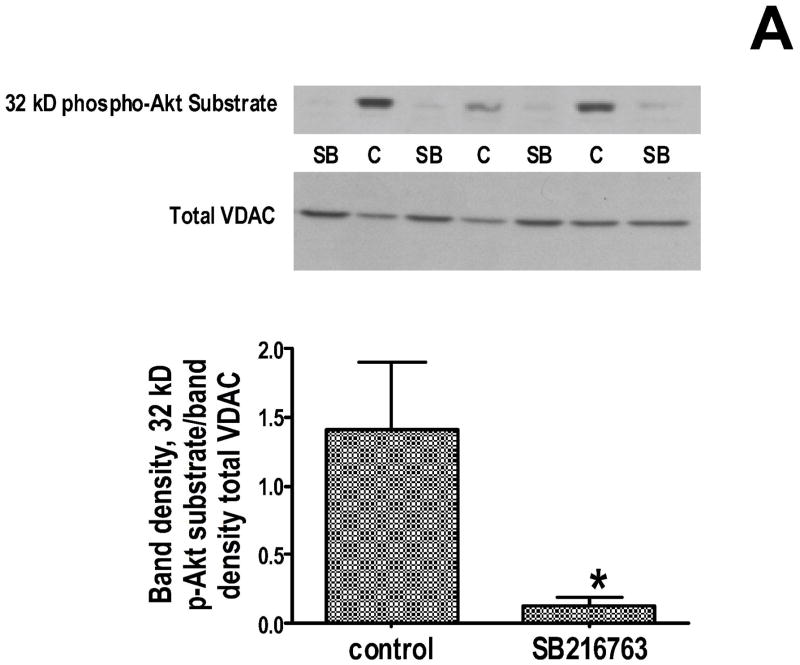
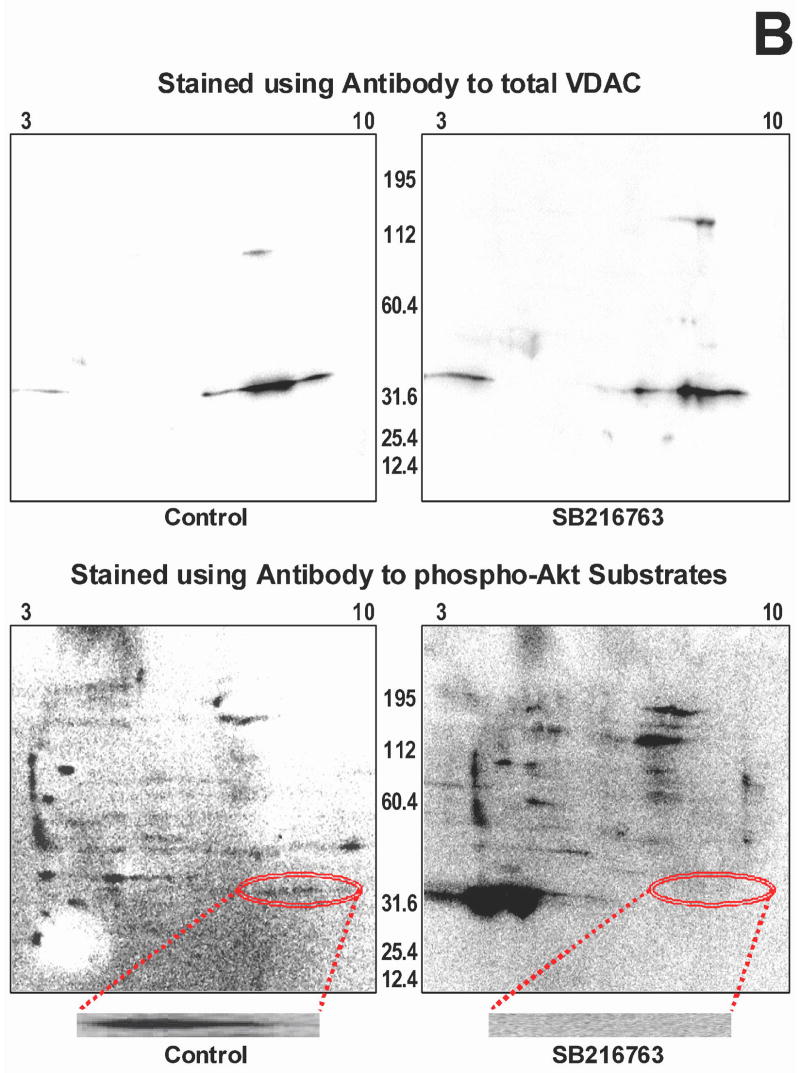
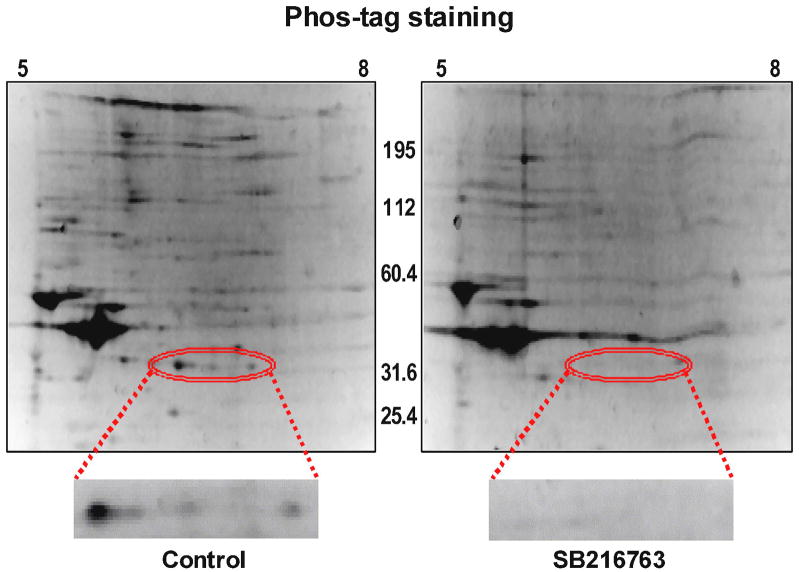
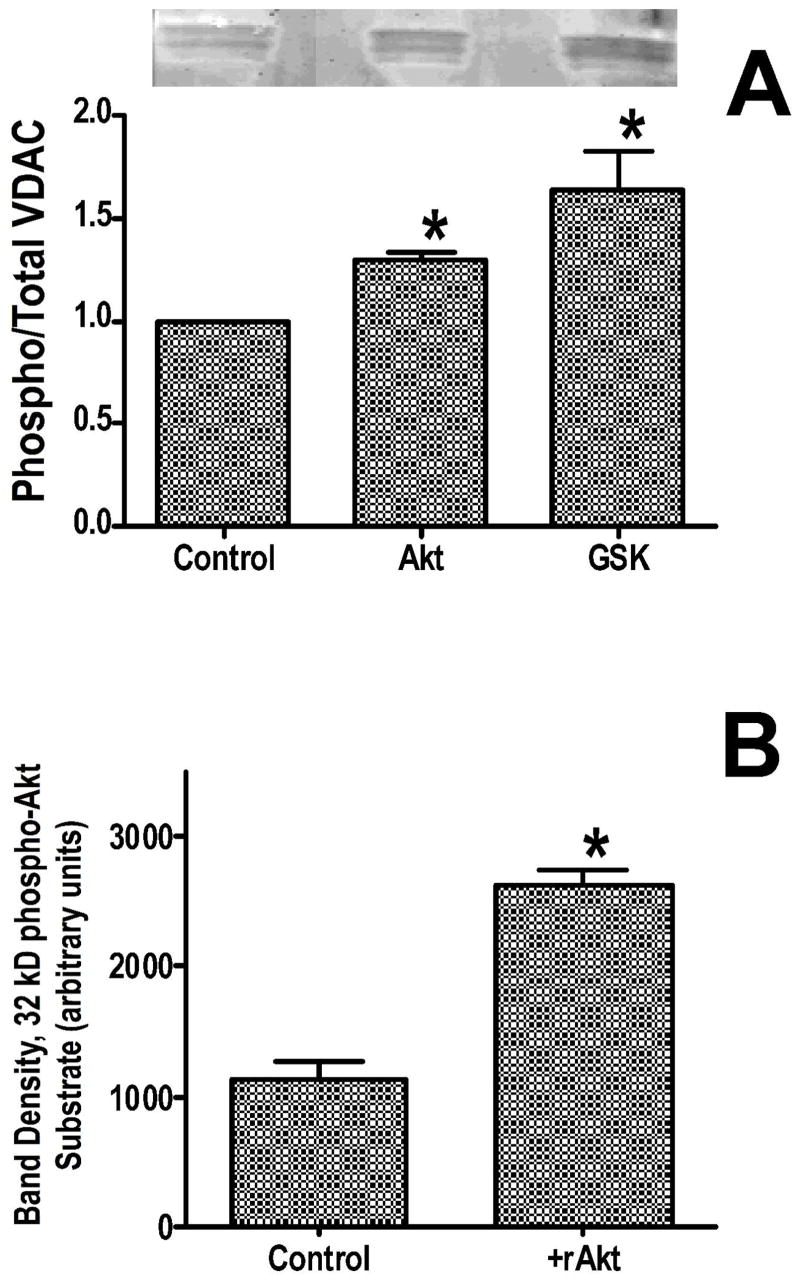
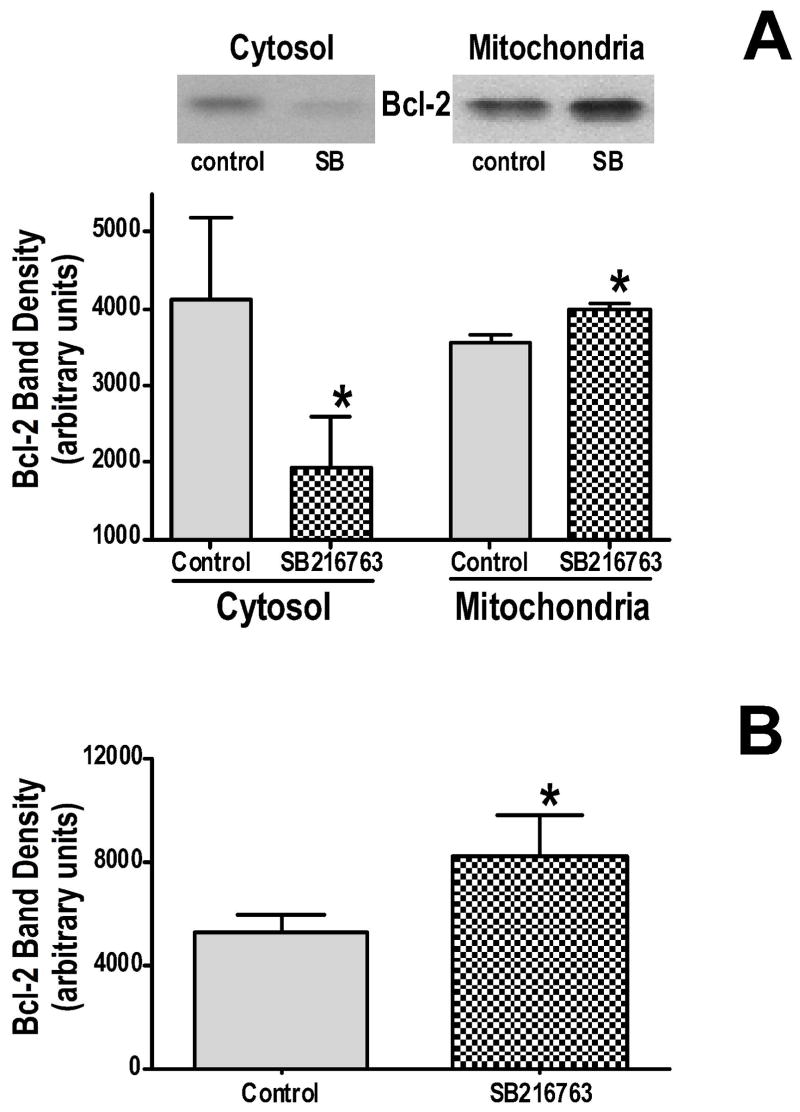
Inhibition of glycogen synthase kinase (GSK)-3 reduces ischemia/reperfusion injury by mechanisms that involve the mitochondria. The goal of this study was to explore possible molecular targets and mechanistic basis of this cardioprotective effect. In perfused rat hearts, treatment with GSK inhibitors before ischemia significantly improved recovery of function. To assess the effect of GSK inhibitors on mitochondrial function under ischemic conditions, mitochondria were isolated from rat hearts perfused with GSK inhibitors and were treated with uncoupler or cyanide or were made anoxic. GSK inhibition slowed ATP consumption under these conditions, which could be attributable to inhibition of ATP entry into the mitochondria through the voltage-dependent anion channel (VDAC) and/or adenine nucleotide transporter (ANT) or to inhibition of the F(1)F(0)-ATPase. To determine the site of the inhibitory effect on ATP consumption, we measured the conversion of ADP to AMP by adenylate kinase located in the intermembrane space. This assay requires adenine nucleotide transport across the outer but not the inner mitochondrial membrane, and we found that GSK inhibitors slow AMP production similar to their effect on ATP consumption. This suggests that GSK inhibitors are acting on outer mitochondrial membrane transport. In sonicated mitochondria, GSK inhibition had no effect on ATP consumption or AMP production. In intact mitochondria, cyclosporin A had no effect, indicating that ATP consumption is not caused by opening of the mitochondrial permeability transition pore. Because GSK is a kinase, we assessed whether protein phosphorylation might be involved. Therefore, we performed Western blot and 1D/2D gel phosphorylation site analysis using phos-tag staining to indicate proteins that had decreased phosphorylation in hearts treated with GSK inhibitors. Liquid chromatographic-mass spectrometric analysis revealed 1 of these proteins to be VDAC2. Taken together, we found that GSK-mediated signaling modulates transport through the outer membrane of the mitochondria. Both proteomics and adenine nucleotide transport data suggest that GSK regulates VDAC and that VDAC may be an important regulatory site in ischemia/reperfusion injury.


Conflict of interest statement

CONFLICTS OF INTEREST: None

Figures

Figure 1
Figure 1
Hearts were perfused for 15 minutes with control buffer, then 15 minutes with GSK inhibitor or vehicle, 20 minutes global ischemia, followed by 40 minutes of reperfusion. Results are Means SEM (n=6). *p<0.05 vs. control.
Figure 2
Figure 2
GSK inhibitors slow ATP consumption. Panel A, mitochondria were de-energized with dinitrophenol for 5 minutes, in Panel B, mitochondria were treated with cyanide for 20 minutes, and in Panel C, mitochondria were anoxic for 60 minutes. Both GSK inhibitors significantly decrease the rate of ATP hydrolysis. Results are Means ± SEM (n=6). *p<0.05 vs. control.
Figure 2
Figure 2
GSK inhibitors slow ATP consumption. Panel A, mitochondria were de-energized with dinitrophenol for 5 minutes, in Panel B, mitochondria were treated with cyanide for 20 minutes, and in Panel C, mitochondria were anoxic for 60 minutes. Both GSK inhibitors significantly decrease the rate of ATP hydrolysis. Results are Means ± SEM (n=6). *p<0.05 vs. control.
Figure 3
Figure 3
Effect of GSK inhibition on mitochondrial adenine nucleotide metabolism. Panel A, mitochondria were de-energized using dinitrophenol, and ATP remaining after 2.5 minutes of incubation was measured. GSK inhibitors have no effect on ATPase activity in sonicated mitochondria. Panel B, cyclosporin A (200 μM) was added to de-energized mitochondria; this had no effect on ATP hydrolysis, in control and GSK inhibitor groups. Results are Means ± SEM (n=6). *p<0.05 vs. intact control. #p<0.05 vs. intact SB216763 treated. ζp<0.05 vs. intact+DNP, SB 216763 treated.
Figure 3
Figure 3
Effect of GSK inhibition on mitochondrial adenine nucleotide metabolism. Panel A, mitochondria were de-energized using dinitrophenol, and ATP remaining after 2.5 minutes of incubation was measured. GSK inhibitors have no effect on ATPase activity in sonicated mitochondria. Panel B, cyclosporin A (200 μM) was added to de-energized mitochondria; this had no effect on ATP hydrolysis, in control and GSK inhibitor groups. Results are Means ± SEM (n=6). *p<0.05 vs. intact control. #p<0.05 vs. intact SB216763 treated. ζp<0.05 vs. intact+DNP, SB 216763 treated.
Figure 4
Figure 4
GSK inhibitors slow the rate of ADP consumption (Panel A) and the rate of AMP production (Panel B) by cyanide-treated mitochondria. Results are Means ± SEM (n=6). *p<0.05 vs. control.
Figure 4
Figure 4
GSK inhibitors slow the rate of ADP consumption (Panel A) and the rate of AMP production (Panel B) by cyanide-treated mitochondria. Results are Means ± SEM (n=6). *p<0.05 vs. control.
Figure 5
Figure 5
Effect of GSK inhibition on phosphorylation of a 32 kD protein. Panel A-top is a representative 1D gel showing the amount of 32 kD phosphorylated Akt substrate protein in control and GSK inhibitor treated heart extracts. Panel A-middle shows the gel re-probed with VDAC antibody, showing no significant difference in total VDAC expression. Gel densitometry was performed for quantitation, and the ratio of 32 kD phospho-protein to total VDAC is plotted. *p<0.05 vs control. In Panel B, whole heart homogenates were further separated using 2D gel electrophoresis. In the upper panels, control homogenate (left) and GSK inhibitor treated homogenate (right) is probed with VDAC antibody. Then the membranes were stripped and reprobed for phosphorylated Akt substate protein (lower images). There is phosphorylated protein in the VDAC region in control but not in GSK inhibitor treated homogenate. The region of interest is circled and shown at higher magnification at the bottom.
Figure 5
Figure 5
Effect of GSK inhibition on phosphorylation of a 32 kD protein. Panel A-top is a representative 1D gel showing the amount of 32 kD phosphorylated Akt substrate protein in control and GSK inhibitor treated heart extracts. Panel A-middle shows the gel re-probed with VDAC antibody, showing no significant difference in total VDAC expression. Gel densitometry was performed for quantitation, and the ratio of 32 kD phospho-protein to total VDAC is plotted. *p<0.05 vs control. In Panel B, whole heart homogenates were further separated using 2D gel electrophoresis. In the upper panels, control homogenate (left) and GSK inhibitor treated homogenate (right) is probed with VDAC antibody. Then the membranes were stripped and reprobed for phosphorylated Akt substate protein (lower images). There is phosphorylated protein in the VDAC region in control but not in GSK inhibitor treated homogenate. The region of interest is circled and shown at higher magnification at the bottom.
Figure 6
Figure 6
Whole heart homogenate protein was separated by 2D gel electrophoresis and stained with phos-tag to detect phosphorylated proteins. Three spots showing marked differences in phosphorylation level, in the 32 kD region (shown in higher magnification), were analyzed by LC-MS, and VDAC-2 was identified by at least 4 peptide fragments, in all three spots.
Figure 7
Figure 7
Panel A illustrates in vitro phosphorylation of semi-purified VDAC, by Akt and GSK-3β. Panel B shows increased 32 kD Akt substrate phosphorylation in isolated mitochondria following addition of recombinant Akt (rAkt). *p<0.05 vs control.
Figure 8
Figure 8
Panel A shows the effect of GSK inhibition on Bcl-2 levels in cytosolic and mitochondrial fractions. Panel B shows the effect of GSK inhibition on the amount of Bcl-2 that is immunoprecipitated by VDAC antibodies. *p<0.05 vs control.

Comment in

Similar articles

Cited by

References

    1. Murry CE, Jennings RB, Reimer KA. Preconditioning with ischemia: a delay of lethal cell injury in ischemic myocardium. Circulation. 1986;74:1124–1136. - PubMed
    1. Gross ER, Gross GJ. Ligand triggers of classical preconditioning and postconditioning. Cardiovasc Res. 2006;70:212–221. - PubMed
    1. Downey JM, Davis AM, Cohen MV. Signaling pathways in ischemic preconditioning. Heart Fail Rev. 2007;12:181–188. - PubMed
    1. Tong H, Rockman HA, Koch WJ, Steenbergen C, Murphy E. G protein-coupled receptor internalization signaling is required for cardioprotection in ischemic preconditioning. Circ Res. 2004;94:1133–1141. - PubMed
    1. Hausenloy DJ, Yellon DM. Reperfusion injury salvage kinase signaling: taking a RISK for cardioprotection. Heart Fail Rev. 2007;12:217–234. - PubMed

Publication types

MeSH terms

Substances