. 2008 Oct 1;181(7):4832-9.
doi: 10.4049/jimmunol.181.7.4832.

NFATc1 regulates PD-1 expression upon T cell activation

Affiliations

NFATc1 regulates PD-1 expression upon T cell activation

Kenneth J Oestreich et al. J Immunol. .

Abstract

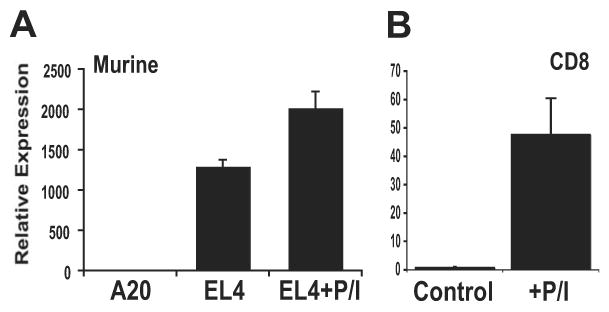
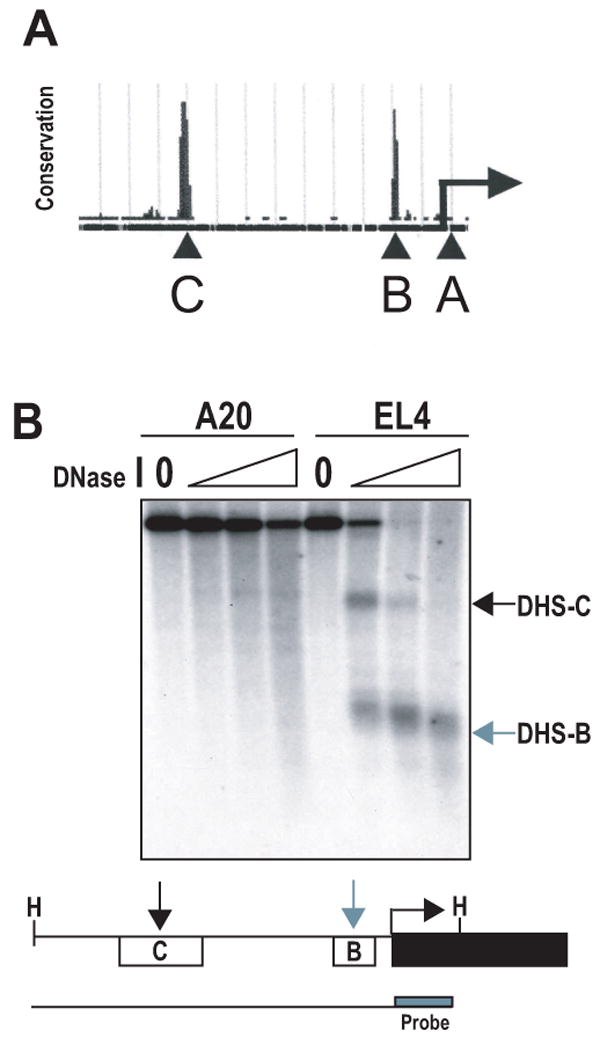
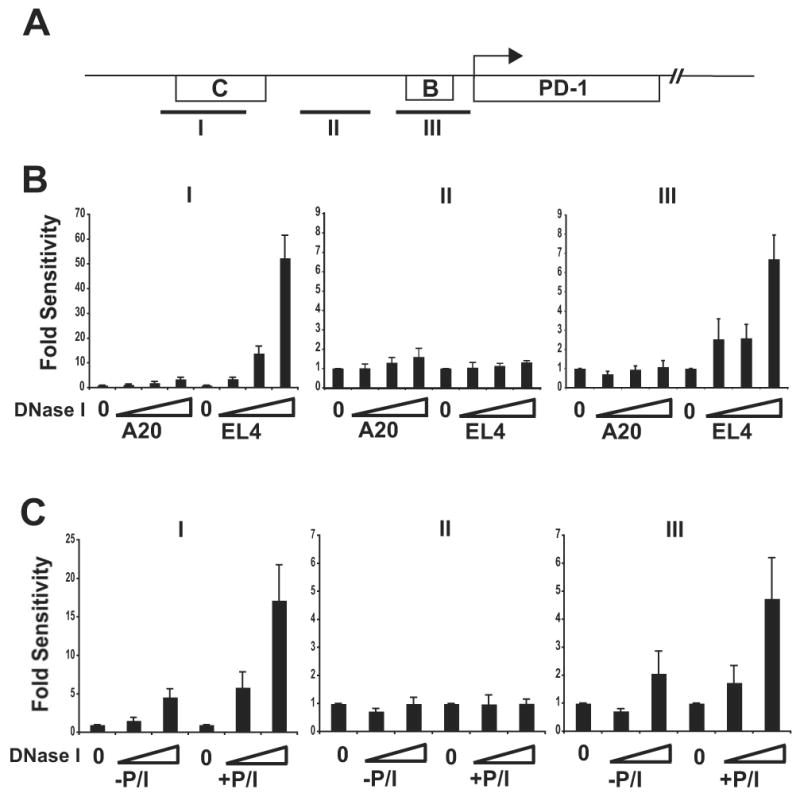
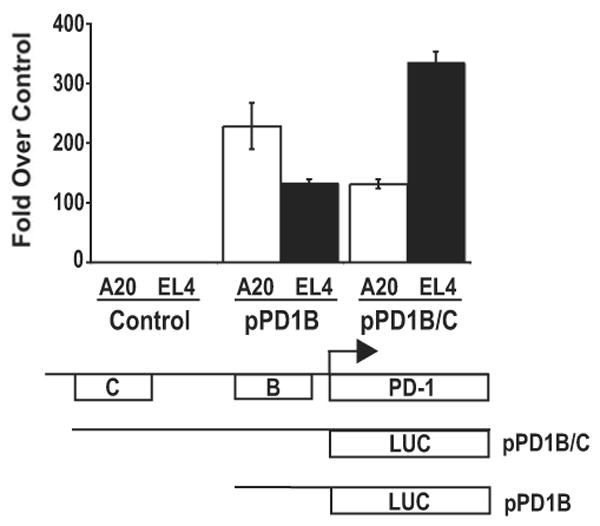
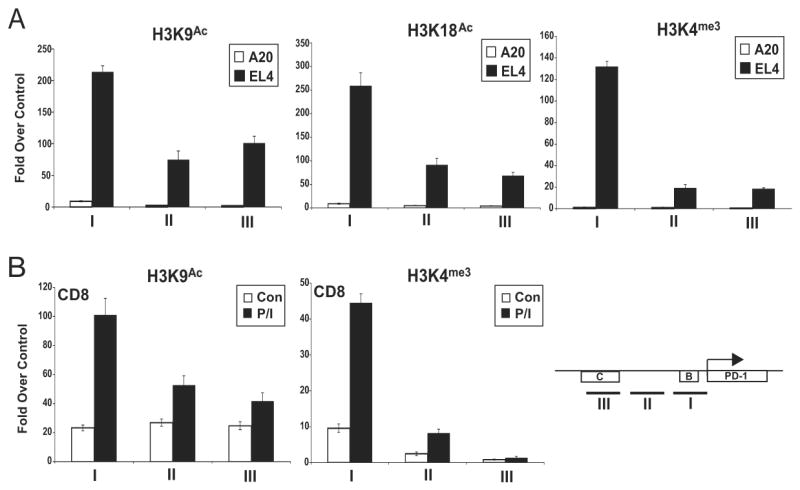
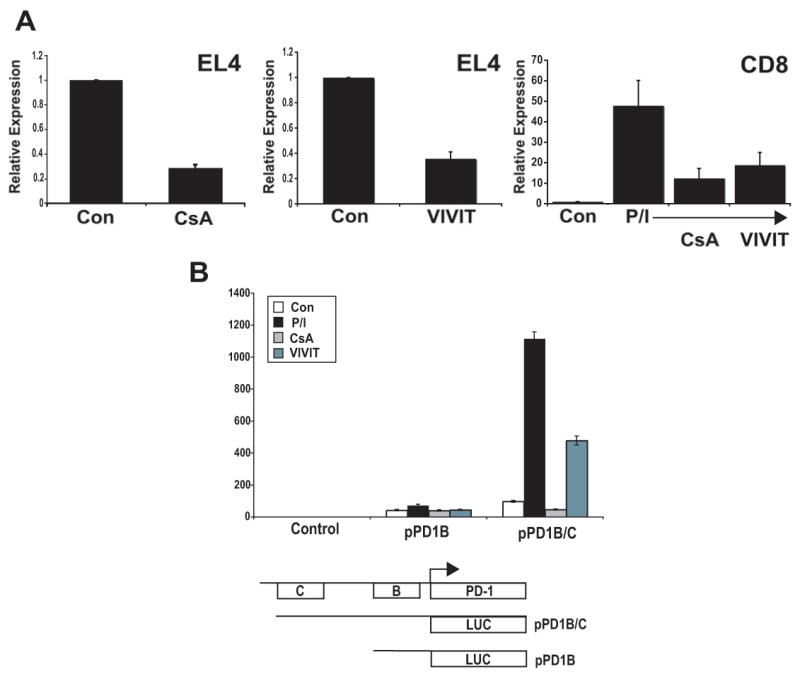
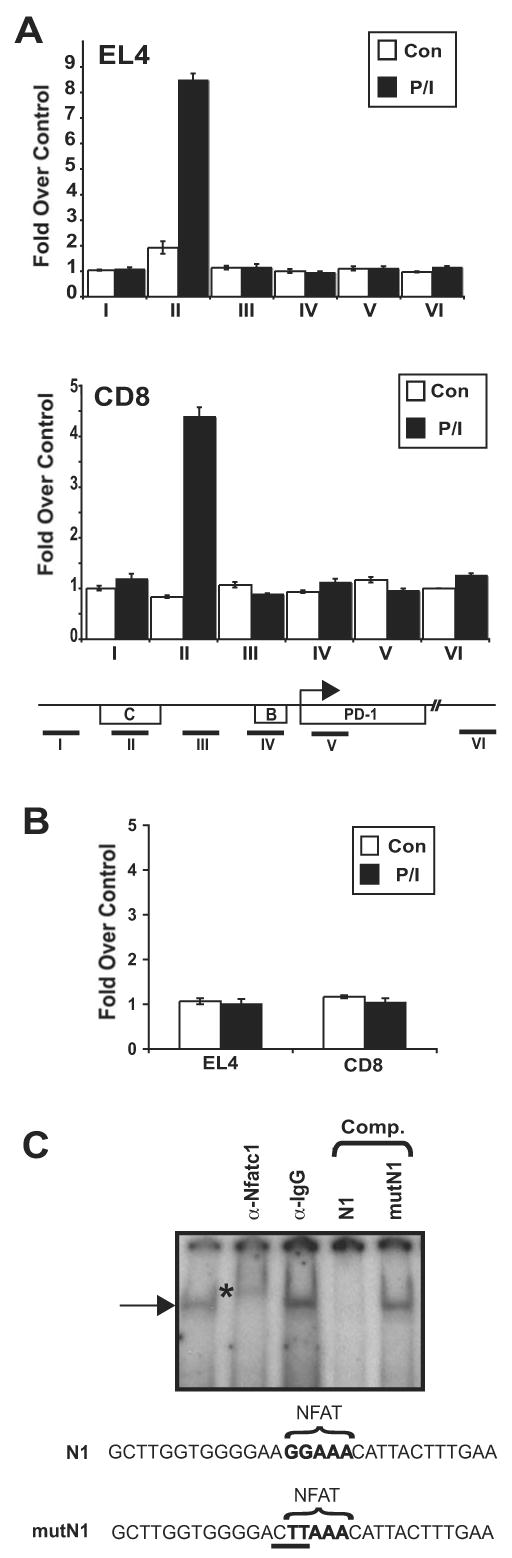
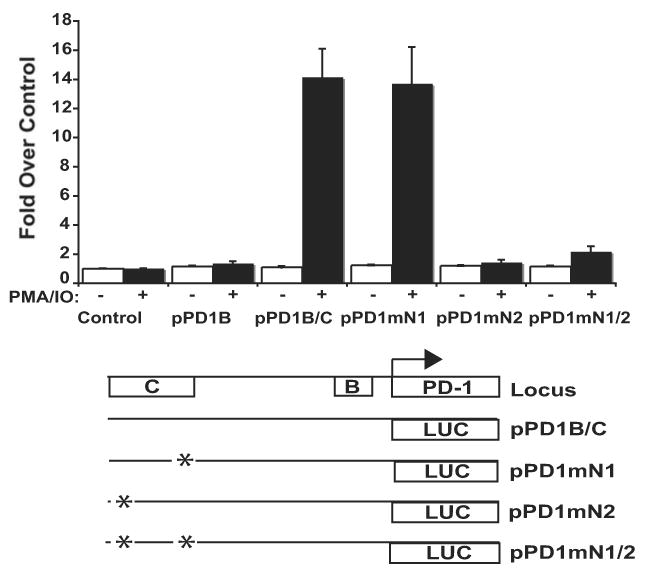
PD-1 is a transmembrane protein involved in the regulation of immunological tolerance. Multiple studies have reported an association between high levels of PD-1 expressed on T cell surfaces and exhaustion in lymphocyte populations when challenged by chronic viral infections, such as HIV. By using model systems consisting of murine EL4 cells, which constitutively express PD-1, and primary murine CD8 T cells that express PD-1 upon T cell stimulation, we have identified two tissue-specific hypersensitive sites at the 5' CR of the PD-1 locus. Gene reporter assays in CD8 T cells have shown that one of these sites has robust transcriptional activity in response to cell stimulation. Cell treatment with the calcineurin inhibitor cyclosporine A or a NFAT-specific inhibitor led to a sharp reduction in PD-1 expression in the constitutive and inducible systems. Furthermore, analysis of this region by chromatin immunoprecipitation assay revealed NFATc1 binding associated with gene activation in EL4 and primary CD8 T cells. Mutation of the NFATc1 binding site in PD-1 reporter constructs resulted in a complete loss of promoter activity. Together, these results demonstrate that PD-1 gene regulation occurs in part via the recruitment of NFATc1 to a novel regulatory element at the pdcd1 locus and provides the molecular mechanism responsible for the induction of PD-1 in response to T cell stimulation.


Conflict of interest statement

Disclosures The authors have no financial conflict of interest.

Figures

Figure 1
Figure 1. Analysis of PD-1 transcription in murine cell lines and primary T cells
(A) Expression levels of pdcd1 transcripts were determined in cell lines by quantitative reverse transcriptase (qRT)-PCR. Where indicated, EL4 cells were treated with PMA/ionomycin overnight (+P/I). Expression levels were normalized to qRT-PCR values obtained for 18s ribosomal RNA. (B) CD8 T cells were isolated as described under Materials and Methods and left untreated or treated with PMA/ionomycin overnight. Following incubation, the cells were harvested and the levels of PD-1 mRNA were determined as above. The data are expressed as fold PD-1 expression over untreated/control CD8 T cells. Each experiment was performed a minimum of three times and standard error bars were calculated.
Figure 2
Figure 2. Two DNase I hypersensitive sites are located in 5′ conserved regions of the pdcd1 locus
(A) The UCSC genome browser was used to identify regions of high DNA sequence conservation in the region 5′ of the PD-1 transcriptional start site (arrow). Two regions were identified and termed B and C (as seen labeled above with capital letters). (B) Nuclei from EL4 and A20 cells were isolated and treated with increasing concentrations of DNase I. Genomic DNA was obtained and digested with HindIII (H) to generate the full-length genomic DNA fragment (line below schematic). Digested DNA was then subjected to Southern blot analysis with a probe specific for the 3′ end of the HindIII fragment (box labeled in schematic). The resulting DNase I hypersensitive sites (DHS) map to conserved regions B and C located 5′ of the pdcd1 gene and are indicated by arrows.
Figure 3
Figure 3. DNase I hypersensitive sites are located in the 5′ conserved region of the pdcd1 locus in primary CD8 T cells expressing PD-1
(A) A schematic of conserved regions of PD-1 and primer set amplicons are shown. (B) Nuclei from A20, EL4, and (C) primary CD8 T (+/- PMA/ionomycin) cells were isolated and treated with increasing concentrations of DNase I. Genomic DNA was isolated and subjected to real-time PCR analysis with primer sets (I, II, and III) spanning portions of the pdcd1 gene. Relative hypersensitivity was assayed by normalization of DNase I treated DNA to that of the genomic (untreated) DNA control and the data are plotted as fold sensitivity. Increasing DNase I concentration is indicated along the X-axis. The data shown are the average (-/+ standard error) of three independent experiments.
Figure 4
Figure 4. Conserved regions B and C encode transcriptionally active sequences
Luciferase reporter gene (pGL3) constructs containing conserved region B, B and C, or vector alone were transiently cotransfected into EL4 or A20 cells with a constitutive renilla luciferase expression vector. Following 24 hours, cells were lysed and assayed for luciferase activity as described in Materials and Methods. Samples were normalized to the renilla luciferase activity and the average values from three independent experiments were plotted as fold over vector alone.
Figure 5
Figure 5. High levels of H3 acetylation and H3K4 trimethylation are found at the PD-1 regulatory regions in PD-1 expressing cells
Chromatin was isolated from (A) A20 and EL4; or (B) primary CD8 T cells (Con) and primary CD8 T cells treated with PMA/ionomycin (P/I). ChIP assays were conducted with the indicated antibodies, and quantitative real-time PCR was used to determine the levels of chromatin modifications at CR-B, the intervening region between CR-B and CR-C and CR-C. The locations of the PCR amplicons are shown in the schematic. Quantitative PCR results were normalized to input DNA amounts and plotted as fold over an irrelevant antibody control (anti-TCR). The results presented were the average (-/+ standard error) of three independent experiments.
Figure 6
Figure 6. NFAT inhibition results in a reduction of PD-1 transcription
(A) NFAT inhibitors reduce PD-1 expression. EL4 cells and primary CD8 T cells (Control, Con; and PMA/Ionomycin treated, P/I) were treated with CsA and VIVIT for 2 days and 5 days, respectively. Following cell treatment, total RNA was harvested and the level of pdcd1 transcripts determined as in Figure 1. (B) NFAT activity is required for activation of reporter genes encoding CR-C. Luciferase reporter gene (pGL3) constructs containing conserved region B, B and C, or vector alone were transiently cotransfected into EL4 cells with a constitutive renilla luciferase expression vector. Transfected cells were then left untreated, treated with PMA/ionomycin (P/I) alone or in combination with CsA or VIVIT. Following overnight incubation, cells were lysed and assayed for luciferase activity as in Figure 4. These data represent an average of at least three independent experiments.
Figure 7
Figure 7. NFATc1 binds to the CR-C regulatory element in vivo and in vitro
ChIP was performed on EL4 and CD8 T cells with antisera specific to (A) NFATc1, (B) NFATc2, or an irrelevant antiserum (anti-TCR). Cells were either untreated (con) or treated with PMA/Ionomycin (P/I) as indicated. Quantitative real-time PCR was used to determine the levels of NFATc1 binding at locations throughout the 5′ conserved region in each cell type. The locations of the PCR amplicons are shown on the schematic below the figures. PCR results were normalized to input DNA amounts and plotted as fold over an irrelevant antibody control (anti-TCR). The results shown represent an averaging of three independent experiments. In (B), data are shown for PCR amplicon II. (C) EL4 nuclear extracts from cells treated with PMA/ionomycin were incubated with the N1 NFAT-encoding binding site probe and antibodies where indicated. DNA binding competition assays were carried out with unlabeled N1 DNA or the same sequence containing a mutated NFAT binding site (mutN1). An asterisk marks the location of the anti-NFATc1 super-shifted complex.
Figure 8
Figure 8. NFATc1 binding is necessary for PD-1 transcriptional regulation
PD-1 promoter reporter constructs (pGL3) containing vector alone, CR-B, CR-B and -C, or CR-B and -C with the indicated NFAT site mutation were transiently transfected into primary CD8 T cells using nucleofection. Cells were left untreated or treated with PMA/ionomycin for six hours. Following incubation, cells were lysed and assayed for luciferase activity as above. The results presented represent the average of three independent transfection assays.

References

    1. Agata Y, Kawasaki A, Nishimura H, Ishida Y, Tsubata T, Yagita H, Honjo T. Expression of the PD-1 antigen on the surface of stimulated mouse T and B lymphocytes. Int Immunol. 1996;8:765–772. - PubMed
    1. Sharpe AH, Wherry EJ, Ahmed R, Freeman GJ. The function of programmed cell death 1 and its ligands in regulating autoimmunity and infection. Nat Immunol. 2007;8:239–245. - PubMed
    1. Okazaki T, Honjo T. The PD-1-PD-L pathway in immunological tolerance. Trends Immunol. 2006;27:195–201. - PubMed
    1. Wherry EJ, Barber DL, Kaech SM, Blattman JN, Ahmed R. Antigen-independent memory CD8 T cells do not develop during chronic viral infection. Proc Natl Acad Sci U S A. 2004;101:16004–16009. - PMC - PubMed
    1. Wherry EJ, Blattman JN, Ahmed R. Low CD8 T-cell proliferative potential and high viral load limit the effectiveness of therapeutic vaccination. J Virol. 2005;79:8960–8968. - PMC - PubMed

Publication types

MeSH terms