. 2008 Oct 1;181(7):4852-63.
doi: 10.4049/jimmunol.181.7.4852.

T cell-dendritic cell immunological synapses contain TCR-dependent CD28-CD80 clusters that recruit protein kinase C theta

Affiliations

T cell-dendritic cell immunological synapses contain TCR-dependent CD28-CD80 clusters that recruit protein kinase C theta

Su-Yi Tseng et al. J Immunol. .

Abstract

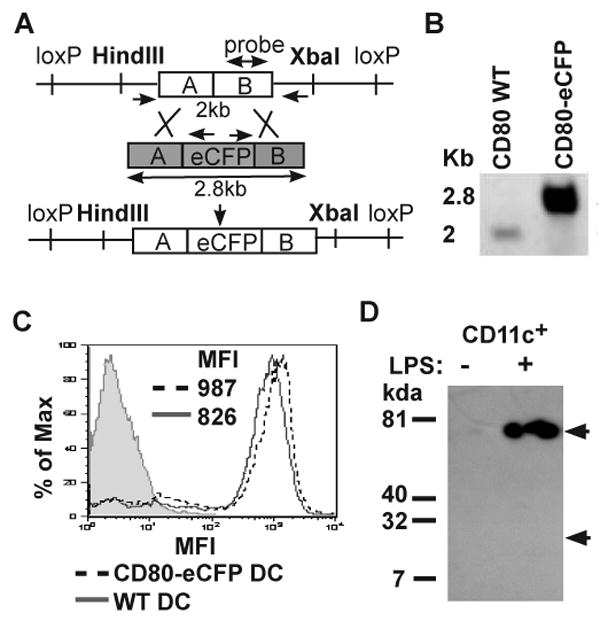
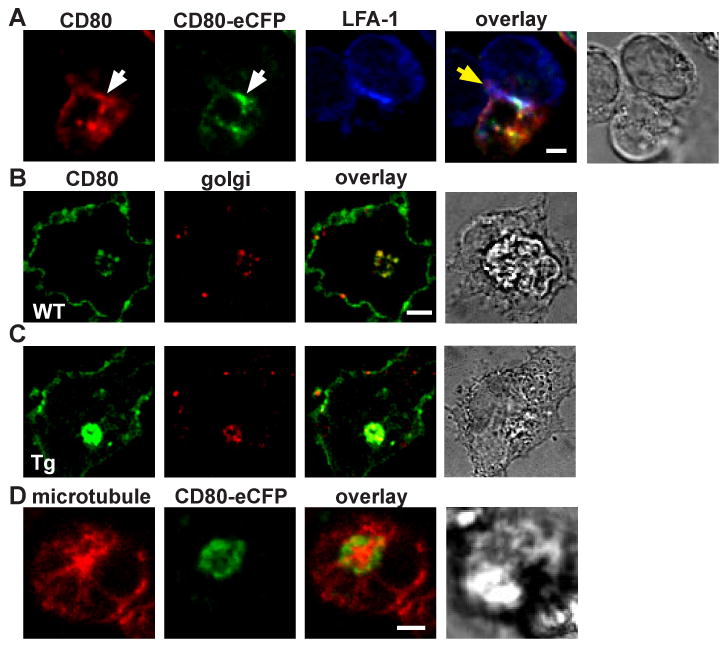
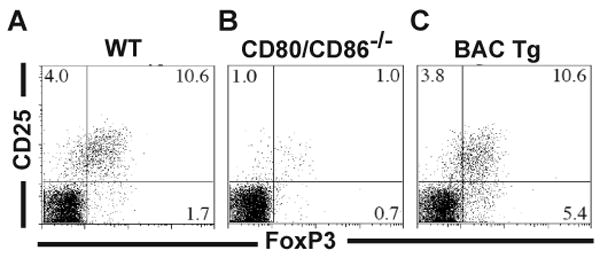
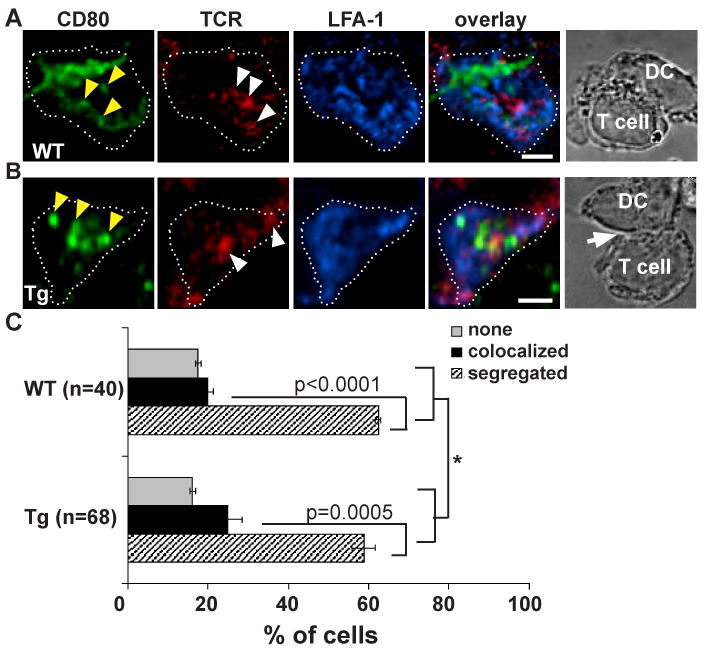
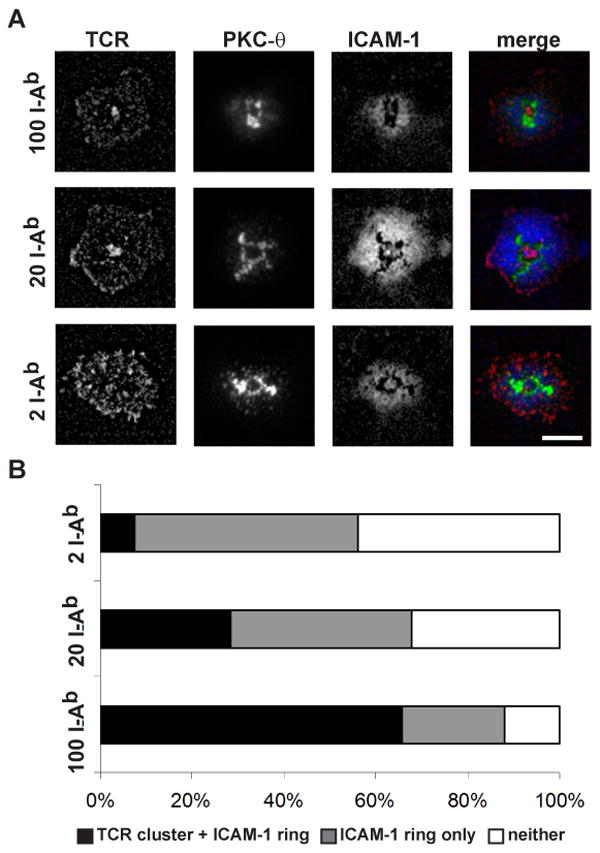
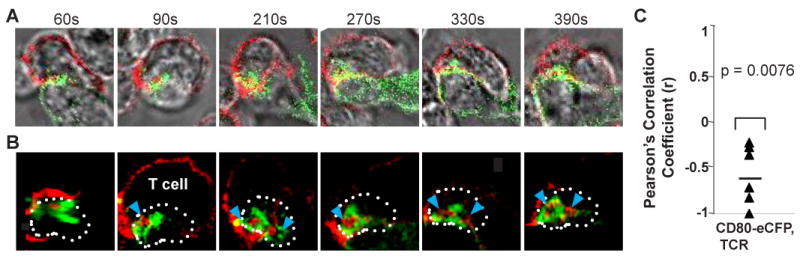
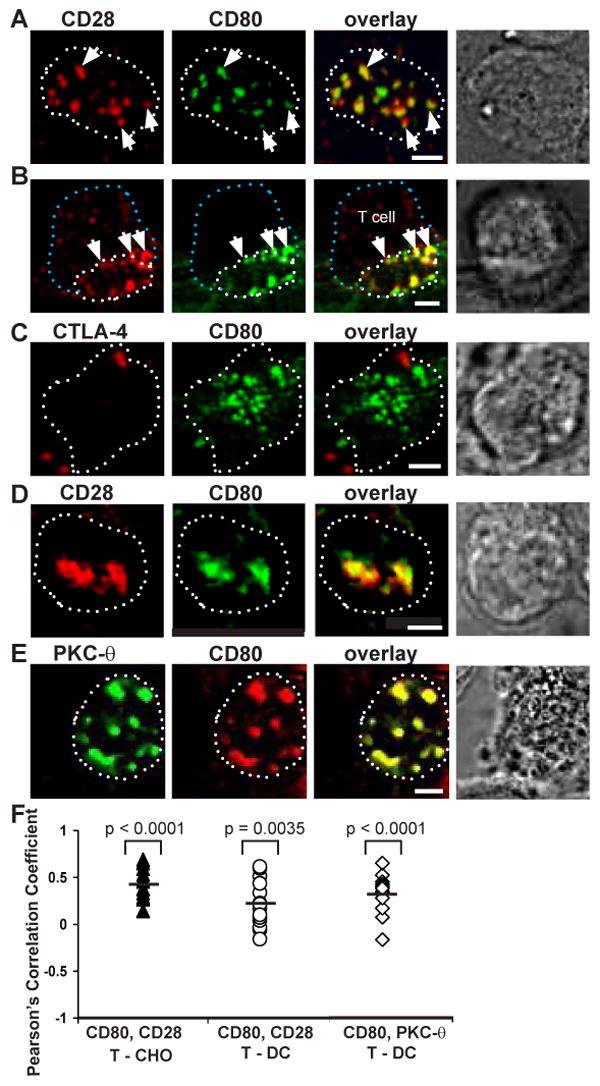
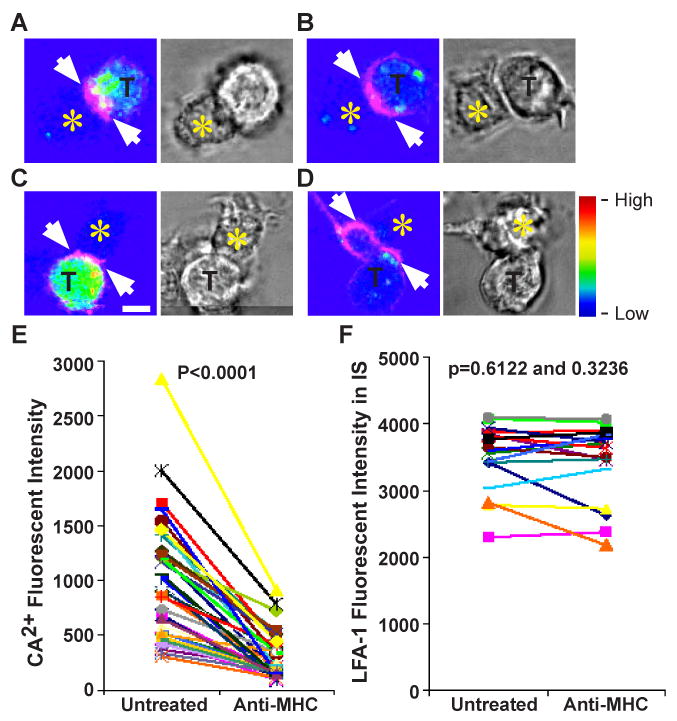
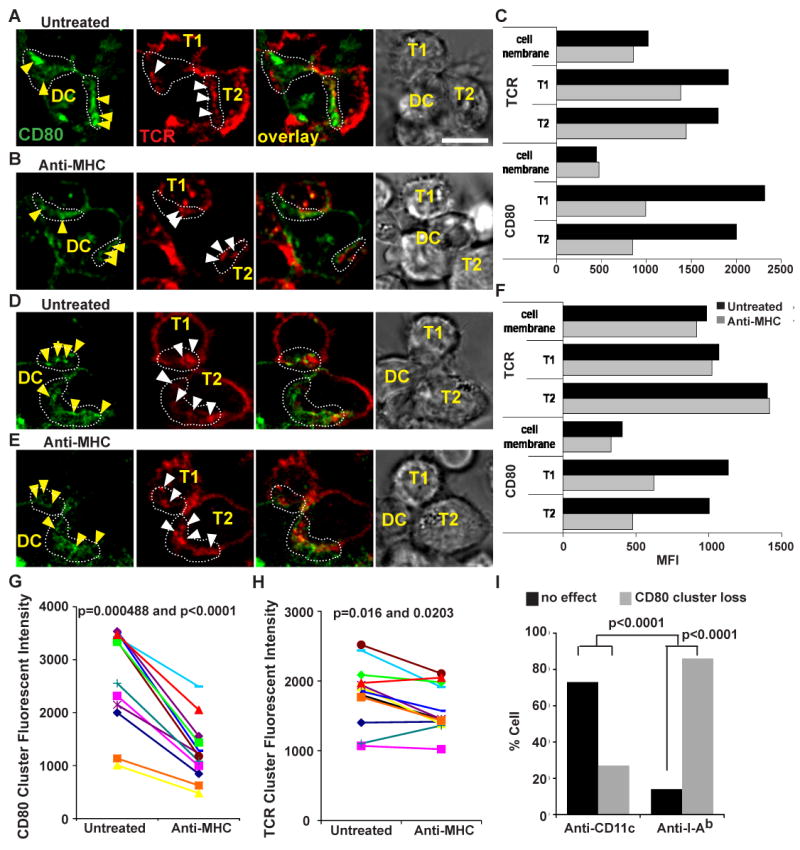
Short-lived TCR microclusters and a longer-lived protein kinase Ctheta-focusing central supramolecular activation cluster (cSMAC) have been defined in model immunological synapses (IS). In different model systems, CD28-mediated costimulatory interactions have been detected in microclusters, the cSMAC, or segregated from the TCR forming multiple distinct foci. The relationship between TCR and costimulatory molecules in the physiological IS of T cell-dendritic cell (DC) is obscure. To study the dynamic relationship of CD28-CD80 and TCR interactions in the T cell-DC IS during Ag-specific T cell activation, we generated CD80-eCFP mice using bacterial artificial chromosome transgenic technology. In splenic DCs, endogenous CD80 and CD80-eCFP localized to plasma membrane and Golgi apparatus, and CD80-eCFP was functional in vivo. In the OT-II T cell-DC IS, multiple segregated TCR, CD80, and LFA-1 clusters were detected. In the T cell-DC synapse CD80 clusters were colocalized with CD28 and PKCtheta, a characteristic of the cSMAC. Acute blockade of TCR signaling with anti-MHC Ab resulted in a rapid reduction in Ca(2+) signaling and the number and size of the CD80 clusters, a characteristic of TCR microclusters. Thus, the T cell-DC interface contains dynamic costimulatory foci that share characteristics of microclusters and cSMACs.


Figures

Figure 1
Figure 1
CD80-eCFP BAC transgene construction. (A) A schematic of BAC Tg construct map. RP23-69GS BAC clone containing CD80 genomic DNA was recombined with shuttle vector (shaded grey) containing inframe eCFP insertion before CD80 stop codon to generate CD80-eCFP BAC transgene. (B) Assessment of eCFP recombination into CD80 genomic DNA BAC clone by southern blot. CD80 BAC WT and CD80-eCFP BAC Tg DNA were digested with HindIII and XbaI restriction enzyme. Positive eCFP insertion increased DNA molecular weight to 2.8kb as compared to WT of 2kb. (C) Analysis of CD80-eCFP expression from BAC Tg. CD11c+ splenic DCs were isolated from BAC Tg on CD80/CD86+/- (dashed line) or WT (solid line) and matured for 16 hrs with LPS/αCD40. The mature DCs were stained with anti-CD80 or isotype control (shaded) mAb and analyzed by flow cytometry. (D) Relative molecular mass of CD80-eCFP. Anti-GFP antibody was used to immunoprecipitate and Immunoblot LPS/αCD40 treated and untreated CD11c+ splenic DC lysates. Immunoprecipitated samples were separated on a reducing 10% SDS-PAGE gel. A single band of 75 kDa was detected in magnetic bead selected CD11c+ population treated with LPS/αCD40. “LPS/αCD40” indicates in vitro treatment for 16 hours with both 12.5 μg/ml of LPS and 1 μg/ml of anti-CD40.
Figure 2
Figure 2
Characterization of CD80-eCFP spatial localization in CD11c+ splenic DC. (A) CD80-eCFP from BAC Tg × CD80/CD86-/- colocalized with CD80 WT in the T cell-DC IS. CD80 WT and CD80-eCFP BAC Tg (green) were stained with anti-CD80 (red), and the T cell was stained with anti-LFA-1 Fab (blue). This is a side view of the IS. Yellow area depicts CD80 and CD80-eCFP colocalization, and white area depicts CD80, CD80-eCFP and LFA-1 colocalization. White arrow bar indicates CD80 accumulation in the IS, and yellow arrow bar indicates T cell-DC interface. (B-C) CD80 accumulated in the Golgi compartment. CD80 WT and CD80-eCFP BAC Tg were stained with anti-CD80 (green) and anti-Golgi (red). Yellow areas depict CD80 and Golgi colocalization, (B) WT DC and (C) CD80-eCFP BAC Tg DC. (D) Intracellular CD80-eCFP accumulated in the periphery of the MTOC. CD80-eCFP is shown in green and β-tubulin in red. CD11c+ splenic DCs were matured overnight with LPS/αCD40. The scale bar is 2 m.
Figure 3
Figure 3
CD80-eCFP rescues regulatory T cell development in mice deficient in CD80 and CD86. Flow cytometry profile of CD25 and FoxP3 staining of CD4+ lymph node cells from (A) WT, (B) CD80/86-/-, and (c) CD80-eCFP BAC Tg × CD80/86-/-.
Figure 4
Figure 4
TCR and CD80 are segregated in the IS of CD11c+ splenic DCs. (A-B) Image of T cell-DC IS. Overnight LPS/αCD40 matured (A) WT and (B) CD80-eCFP DC pulsed with 5μM OVA were fixed (non-permeabilizing conditions) 30 minutes after adding OT-II T cells and stained with non-blocking antibodies to TCR (H57) and LFA-1 (H155). The distribution of molecules was analyzed in at least 2 independent experiments in WT and CD80-eCFP. CD80 is shown in green, TCR in red, and LFA-1 in blue. Images were cross-section of a 3-D plane rotated in an en face view. Dotted white line depicts the interface of the IS. Solid yellow arrow depicts cluster of CD80 accumulations, and solid white arrow depicts cluster of TCR accumulations. The transmitted light image depicts a side view of T cell – DC conjugate. The scale bar is 2 m. (C) Quantification of CD80 accumulation patterns with respect to the TCR of (A) versus (B) in the IS over a 30 min time point. WT is shown in black and CD80-eCFP in grey. CD80 clusters segregated from TCR clusters were scored as “segregated” and CD80 clusters colocalized with the TCR clusters partially or entirely were scored as “colocalized”. When there were no CD80 clusters in the interface these were scored as “none”. The difference in molecular accumulation between segregated and colocalized is extremely statistically significant with a p-value of 0.0001 and 0.0005 for WT and CD80-eCFP, respectively, using multinomial test for equal probabilities. (*) The patterns of molecular segregation were not significantly different between WT and CD80-eCFP expressing DCs, p-value = 0.850 using Fisher exact test.
Figure 5
Figure 5
OT-II T cells formed defined cSMAC and pSMAC in the supported planar bilayer system. (A) The supported planar bilayers were armed with 2, 20, or 100 I-Ab-OVA323-339/μm2, and fixed densities of Cy5-ICAM-1-GPI and CD80-GPI. The OT-II effector T cells were allowed to interact with the bilayers at 37°C and fixed at 15 min. TCR was followed with Alexa568-H57 and PKC-θ was detected with a rabbit anti-sera after fixation and permeabilization. In the merged images TCR is shown in red, PKC-θ is shown in green, and ICAM-1 is shown in blue. The scale bar is 5 μm. (B) Quantification of OT-II T cell – bilayer IS pattern formation. All contacts could be categorized as having a central TCR cluster + the ICAM-1 ring, an ICAM-1 ring only, or neither. Chi square test gave a p-value < 0.0001 for I-Ab-OVA323-339 concentration dependence of the patterns.
Figure 6
Figure 6
Dynamics of CD80 and TCR clusters in T cell-DC interface. A time series of Alexa 568-H57 Fab labeled OT-II CD4+ TCR Tg T cells interacting with mature CD80-eCFP DC. Time is relative to first detected contact area at 60 second. (A) Transmitted light images of T cell – DC conjugate. The fluorescence intensities of these images were enhanced in order to delineate the physical location of the T cell and DC. (B) Cross-section of a 3-D plane rotated in an en face view. Dotted white line depicts the interface of the IS. CD80 is shown in green and TCR is shown in red. Solid blue arrow depicts cluster of TCR accumulation. This sequence is representative of two experiments with at least 10 cells. (C) The degree of segregation between CD80 and TCR is represented by mean Pearson's Correlation Coefficient r. One sample t-test gave a p value = 0.0076 suggesting that the r value is significantly different from zero and that CD80 and TCR are negatively correlated.
Figure 7
Figure 7
CD80 interactions with its ligands in the IS. T cell-CHO cell conjugates were fixed 15 min after adding 5C.C7 CD4+ T cells. (A-B) CD80 colocalized with CD28 in the IS. (A) en face view of the T cell and CHO cell interface. (B) Cross section of a semi-side view of a T cell and CHO cell conjugate. (C) At this time point, CD80 colocalization with CTLA-4 was not detected in T cell and CHO cell interface. (D) CD28 and CD80 colocalized in the T cell and DC interface of CD80-eCFP (CD80-/+CD86-/-) DC. (E) CD80 clusters colocalized with PKC-θ clusters in the T cell and DC interface of CD80-eCFP (CD80-/+ CD86-/-) DC. (F) Degree of colocalization represented by mean r. Solid triangles represent r for CD80 and CD28 in T cell-CHO cell IS. Open circles represent r for CD80 and CD28 in T cell-DC IS. Open triangles represent r for CD80 and PKC- θ in T cell-DC IS. One sample t-test gave p values < 0.0001, = 0.0035, and < 0.0001, respectively; suggesting that the r value is significantly different from zero and these receptors are positively correlated. CD28, CTLA-4 and PKC-θ are shown in red, CD80 in green, and colocalization in yellow. The dotted white lines represent the limits of the interface, the dotted blue line represents the back of the T cell, and the white arrows depict cluster colocalization. Images were cross-section of a 3-D plane rotated in an en face view. The scale bar is 2 μm.
Figure 8
Figure 8
Acute disruption of TCR signaling decreased Ca2+ flux but not LFA-1 accumulation. (A-D) Two examples of Fluo-Lojo (color coded) and LFA-1 Fab (magenta) labeled OT-II TCR Tg T cells (T)-DC (unlabeled, yellow star) IS. Next to the fluorescent panels are the bright field transmitted light images of T cell-DC conjugates. (A and C) Color-coded Ca2+ fluorescent images taken 5 min after T cell addition and before anti-MHC antibody treatment. (B and D) Color-coded Ca2+ fluorescent images were taken 8 min after anti-MHC treatment. White arrow depicts LFA-1 polarization before and after anti-MHC treatment. The scale bar is 5 μm. The rainbow scale indicates relative Fluo-Lojo fluorescent intensity. (E) Quantification of Ca2+ flux as a measure of Fluo-Lojo fluorescent intensity. Conjugates were imaged before and every 4-5 min after anti-MHC treatment for up to 15 min. The difference in fluorescent intensity before and after anti-MHC treatment is statistically significant with a p-value less then 0.0001 using Wilcoxon signed rank test and Paired t-test. (F) Quantification of LFA-1 fluorescent intensity in the IS of T cells before and after anti-MHC treatment. The LFA-1 remained polarized after anti-MHC treatment. The difference in fluorescent intensity before and after anti-MHC treatment is not statistically significant with a p-value of 0.6122 and 0.3236 using Wilcoxon signed rank test and Paired t-test gave, respectively. The decrease in Ca2+ fluorescent intensity observed was analyzed in at least 2 independent experiments with n >35 cells examined per experiment.
Figure 9
Figure 9
CD80 interaction in the IS is dependent on continuous TCR signaling. (A and D) Images of untreated, and (B and E) images of 10-15 min anti-MHC treated T cell-CD80-eCFP DC. (C and F) MFI of TCR and CD80 accumulation in the interface of T cell-DC untreated in (A) and (D) respectively, and anti-MHC treated in (B) and (E) respectively. Fluorescent intensity quantitation of CD80 (G) and TCR (H) clusters before and after anti-MHC antibody treatment in the T cell-DC IS. The difference in CD80 fluorescent intensity before and after anti-MHC treatment is statistically significant with a p-value = 0.0004883 and p-value < 0.0001 using Wilcoxon signed rank test and Paired t-test, respectively. The difference in TCR fluorescent intensity before and after anti-MHC treatment is statistically significant with a p-value = 0.016 and 0.0203 using Wilcoxon signed rank test and Paired t-test, respectively. N = 12 ISs were scored for CD80 and TCR fluorescent intensity before and after anti-MHC treatment. (I) Quantitation of CD80 clusters loss in the T cell-DC IS after acutely blocking TCR signals. Anti-CD11c antibody was used as an irrelevant antibody control. The difference in cluster loss versus no effect after anti-MHC treatment is statistically significant with a p-value < 0.0001 using the exact Binomial test. The difference in cluster loss versus no effect between anti-MHC and anti-CD11c treatment is statistically significant with a p-value < 0.0001 using the Fisher exact test. Conjugates were imaged every 4-5 min after anti-MHC treatment for up to 15 min. CD80 is shown in green and TCR in red. The distribution of molecules and loss in CD80 clusters were analyzed in at least 3 independent experiments with n > 20 cells examined per experiment. The yellow arrows indicate CD80 accumulation, and white arrows indicate TCR accumulation. The scale bar is 5 μm.

References

    1. Delon J, Bercovici N, Raposo G, Liblau R, Trautmann A. Antigen-dependent and -independent Ca2+ responses triggered in T cells by dendritic cells compared with B cells. J Exp Med. 1998;188:1473–1484. - PMC - PubMed
    1. Bousso P, Robey E. Dynamics of CD8+ T cell priming by dendritic cells in intact lymph nodes. Nat Immunol. 2003;4:579–585. - PubMed
    1. Miller MJ, Safrina O, Parker I, Cahalan MD. Imaging the single cell dynamics of CD4+ T cell activation by dendritic cells in lymph nodes. J Exp Med. 2004;200:847–856. - PMC - PubMed
    1. Shakhar G, Lindquist RL, Skokos D, Dudziak D, Huang JH, Nussenzweig MC, Dustin ML. Stable T cell-dendritic cell interactions precede the development of both tolerance and immunity in vivo. Nat Immunol. 2005;6:707–714. - PMC - PubMed
    1. Mempel TR, Henrickson SE, Von Andrian UH. T-cell priming by dendritic cells in lymph nodes occurs in three distinct phases. Nature. 2004;427:154–159. - PubMed

Publication types

MeSH terms