. 2008 Oct 1;181(7):4918-25.
doi: 10.4049/jimmunol.181.7.4918.

CD8 T cells utilize TRAIL to control influenza virus infection

Affiliations

CD8 T cells utilize TRAIL to control influenza virus infection

Erik L Brincks et al. J Immunol. .

Erratum in

  • J Immunol. 2008 Nov 15;181(10)7428

Abstract

Elimination of influenza virus-infected cells during primary influenza virus infections is thought to be mediated by CD8(+) T cells though perforin- and FasL-mediated mechanisms. However, recent studies suggest that CD8(+) T cells can also utilize TRAIL to kill virally infected cells. Therefore, we herein examined the importance of TRAIL to influenza-specific CD8(+) T cell immunity and to the control of influenza virus infections. Our results show that TRAIL deficiency increases influenza-associated morbidity and influenza virus titers, and that these changes in disease severity are coupled to decreased influenza-specific CD8(+) T cell cytotoxicity in TRAIL(-/-) mice, a decrease that occurs despite equivalent numbers of pulmonary influenza-specific CD8(+) T cells. Furthermore, TRAIL expression occurs selectively on influenza-specific CD8(+) T cells, and high TRAIL receptor (DR5) expression occurs selectively on influenza virus-infected pulmonary epithelial cells. Finally, we show that adoptive transfer of TRAIL(+/+) but not TRAIL(-/-) CD8(+) effector T cells alters the mortality associated with lethal dose influenza virus infections. Collectively, our results suggest that TRAIL is an important component of immunity to influenza infections and that TRAIL deficiency decreases CD8(+) T cell-mediated cytotoxicity, leading to more severe influenza infections.


Conflict of interest statement

Disclosures

The authors have no financial conflict of interest

Figures

FIGURE 1
FIGURE 1
TRAIL deficiency correlates with increased disease severity after influenza virus infection. A, C57BL/6 TRAIL+/+ (○) or TRAIL−/− (▲) mice (n = 4 mice/group) were infected with influenza and weighed daily to assess morbidity. The values displayed represent the daily weight relative to the weight on day of infection (i.e. starting weight). *, p < 0.05, Mann-Whitney Rank Sum Test. No significant differences in mortality existed between the two groups. Data are representative of 2 separate experiments. B, Pulmonary virus titers were assessed by determining TCID50 in MDCK cell cultures (as described in the Materials and Methods). *, p = 0.002, Mann-Whitney Rank Sum Test. Viral clearance was significantly different between the TRAIL+/+ and TRAIL−/− with a p = 0.036 as analyzed by a Kaplan-Meier Survival Analysis: Log-Rank.
FIGURE 2
FIGURE 2
Expression of effector molecule and receptor mRNA is equivalent in the lungs of TRAIL+/+ and TRAIL−/− mice during influenza virus infection. TRAIL, DR5, FasL, Fas, perforin, and Granzyme B mRNA expression in the lungs of TRAIL+/+ (■) and TRAIL−/− (●) mice were determined by quantitative RT-PCR on d 4, 6, 8, 14, 18, and 21 after infection. 18s rRNA was used to normalize the gene expression. Data are representative of 2 independent experiments.
FIGURE 3
FIGURE 3
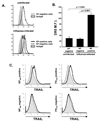
Pulmonary expression of TRAIL-receptor (DR5) and TRAIL occur in an influenza-specific fashion. At d 4 p.i., lungs were harvested from TRAIL+/+ mice and prepared into a single cell suspension. A, Isolated cells were stained with anti-T1α, anti-DR5, and anti-NP or respective isotype controls. The top histogram represents the basal DR5 expression in uninfected T1α-positive pulmonary cells (dashed line) relative to the DR5-isotype control (shaded histogram). The bottom histogram shows DR5 expression on T1α+/NP+ (solid line) and T1α+/NP (dashed line) pulmonary cells relative to the isotype control (shaded histogram). B, DR5 mean fluorescence intensity (MFI) on NP+ and NP T1α+ cells from the lungs of infected mice (n = 5). Data are representative of 3 individual experiments. C, On day 8 p.i. cells isolated from TRAIL+/+ mice were stained with anti-CD8α, anti-CD3ε, NP366 and PA224 tetramers, and anti-TRAIL (open histograms) or isotype controls (shaded histograms). Data are representative of 5 mice from 2 experiments. Similar influenza-specific expression of TRAIL on CD8+ T cells was observed in the draining lymph nodes on day 6p.i (data not shown).
FIGURE 4
FIGURE 4
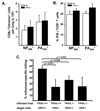
Despite similar CD8+ T cell responses, cytotoxicity is decreased in influenza virus-infected TRAIL−/− animals. At d 8 p.i., lungs were harvested from C57BL/6 TRAIL+/+ (□) or TRAIL−/− (■)mice. A, Isolated cells from TRAIL+/+ or TRAIL−/− mice were stained with anti-CD8α, NP366 tetramer or PA224 tetramer, and anti-CD3ε and the number of CD8+tetramer+ T cells (mean ± SD) enumerated using total counts and flow cytometry. ANOVA analysis yielded no significant differences among the number of TRAIL+/+ and TRAIL−/− tetramer+ T cells or between the individual tetramers. Data are representative of 3 experiments. B, Pulmonary cells were incubated with NP366 and PA224 peptides (or control media); the frequency of antigen-specific T cells was measured by IFNγ ICS. Shown is the percentage of IFN-γ+ of CD8+ cells. Equal numbers of IFN-γ+CD8 T cells were observed in both groups (data not shown). ANOVA analysis yielded no significant differences between the number or percentage of TRAIL+/+ and TRAIL−/− IFNγ+ T cells or between the two epitopes. Data are representative of 2 experiments. C, The pulmonary influenza-specific CD8+ T cell response in TRAIL+/+ (○) or TRAIL−/− (●) mice was measured by in vivo cytotoxicity assay on d 8 p.i. Target cells were purified from DR5+/+ and DR5−/− were used as indicated. Targets from DR5+/+ were verified to be DR5+ by flow cytometry (data not shown). Percent influenza-specific killing was calculated by comparing unpulsed target lysis to influenza-peptide pulsed target lysis. Target frequencies were normalized to ratios harvested from transfers into naϊve mice. *, p = 0.029 determined using a 24 paired t-test.
FIGURE 5
FIGURE 5
TRAIL−/− and TRAIL+/+ influenza-specific CD8+ T cells have similar granzyme B and FasL expression as well as similar degranulation. At d 8 p.i., lungs were harvested from C57BL/6 TRAIL+/+ or TRAIL−/− mice. A, Isolated cells were stained with anti-CD8α, NP366 tetramer, PA224 tetramer, anti-granzyme B or isotype control, or anti-FasL or isotype control mAb. Upper panels show Granzyme B (left) or FasL expression (right) on CD8+NP366 + cells from C57BL/6 TRAIL+/+ or TRAIL−/− mice. Lower panels show Granzyme B (left) or FasL expression (right) on CD8+PA224 + cells from TRAIL+/+ or TRAIL−/− mice. Gray histograms represent isotype control staining. Histograms are representative of 5 mice and 2 separate experiments. B, Isolated cells were incubated with NP366 and PA224 (or control media), BFA, and anti-CD107a for 5 h. After incubation, the cells were stained with anti-CD8 and anti-IFN-γ. Histograms represent the CD107a expression on CD8+IFN-γ+ cells from TRAIL+/+ or TRAIL−/− mice. Histograms are representative of 5 mice and 2 separate experiments.
FIGURE 6
FIGURE 6
Transfer of pulmonary CD8+ T cells from influenza-infected TRAIL+/+ mice, but not TRAIL−/− mice, reduces the mortality of lethal dose influenza-infected mice. At d 8 p.i., lungs were harvested from C57BL/6 TRAIL+/+ or TRAIL−/− mice. CD8+ T cells were isolated and transferred i.v. into mice that had been previously infected with a lethal dose of influenza virus (transfer made at day 5 p.i.). The values displayed represent the current percentage of mice surviving after receiving TRAIL+/+ T cells, TRAIL−/− T cells, or no transfer of cells. Data represent 2 pooled experiments (total mice no transfer n=9; total mice receiving TRAIL−/− T cells n=9; total receiving TRAIL+/+ T cells n = 6). No transfer vs. TRAIL+/+ transfer, p = 0.00551; TRAIL+/+ transfer vs. TRAIL−/− transfer, p = 0.05; no transfer vs. TRAIL−/− transfer, p = 0.517.

Similar articles

Cited by

References

    1. Lukacher AE, Braciale VL, Braciale TJ. In vivo effector function of influenza virus-specific cytotoxic T lymphocyte clones is highly specific. J Exp Med. 1984;160:814–826. - PMC - PubMed
    1. Doherty PC. Cytotoxic T cell effector and memory function in viral immunity. Curr Top Microbiol Immunol. 1996;206:1–14. - PubMed
    1. Topham DJ, Tripp RA, Doherty PC. CD8+ T cells clear influenza virus by perforin or Fas-dependent processes. J Immunol. 1997;159:5197–5200. - PubMed
    1. Epstein SL, Lo CY, Misplon JA, Bennink JR. Mechanism of protective immunity against influenza virus infection in mice without antibodies. J Immunol. 1998;160:322–327. - PubMed
    1. Topham DJ, Doherty PC. Clearance of an influenza A virus by CD4+ T cells is inefficient in the absence of B cells. J Virol. 1998;72:882–885. - PMC - PubMed

Publication types

MeSH terms

Substances