

STAT4 isoforms differentially regulate Th1 cytokine production and the severity of inflammatory bowel disease
- PMID: 18802110
- PMCID: PMC2596939
- DOI: 10.4049/jimmunol.181.7.5062
STAT4 isoforms differentially regulate Th1 cytokine production and the severity of inflammatory bowel disease
Abstract
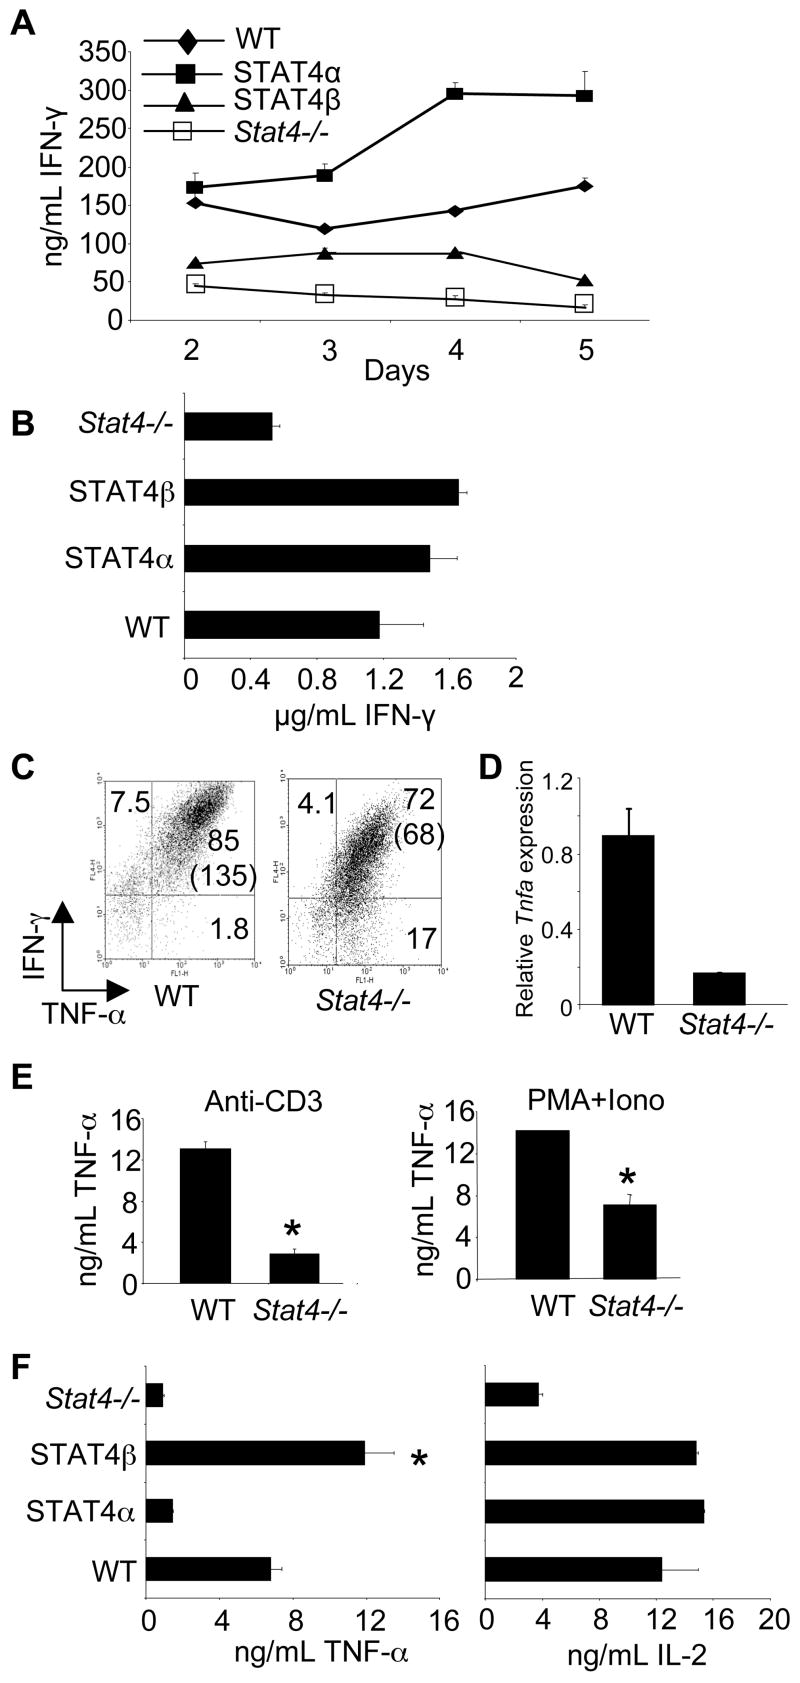
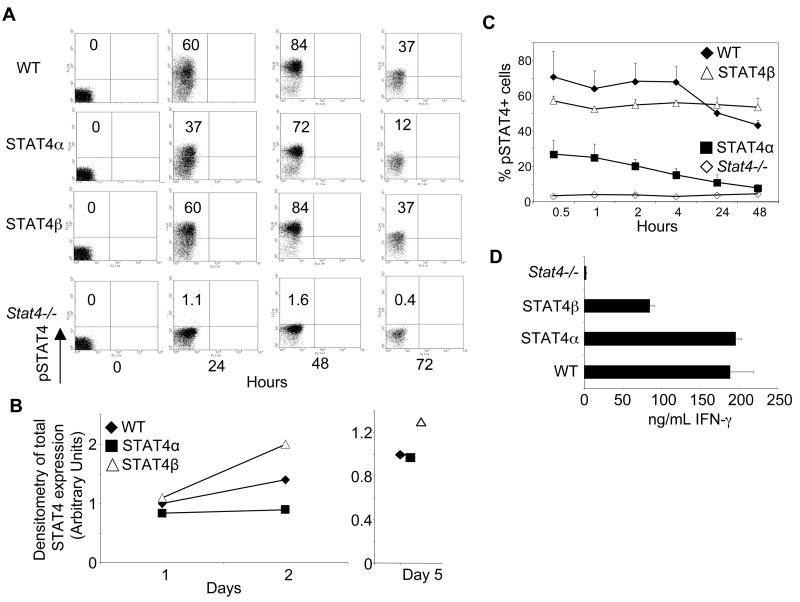
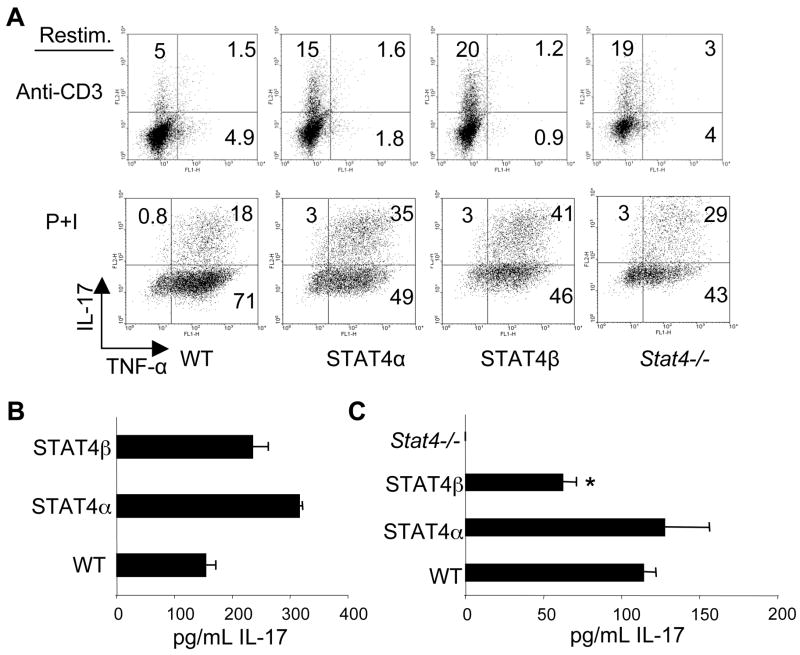
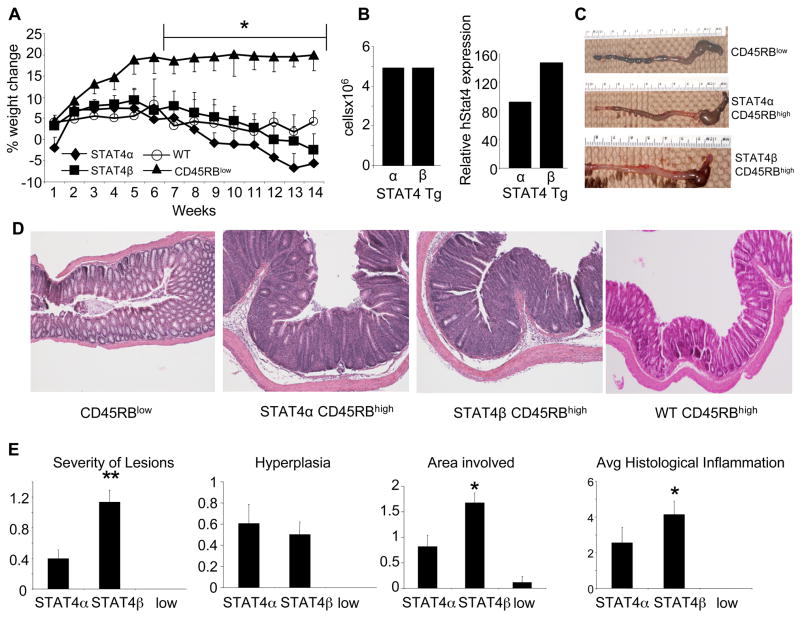
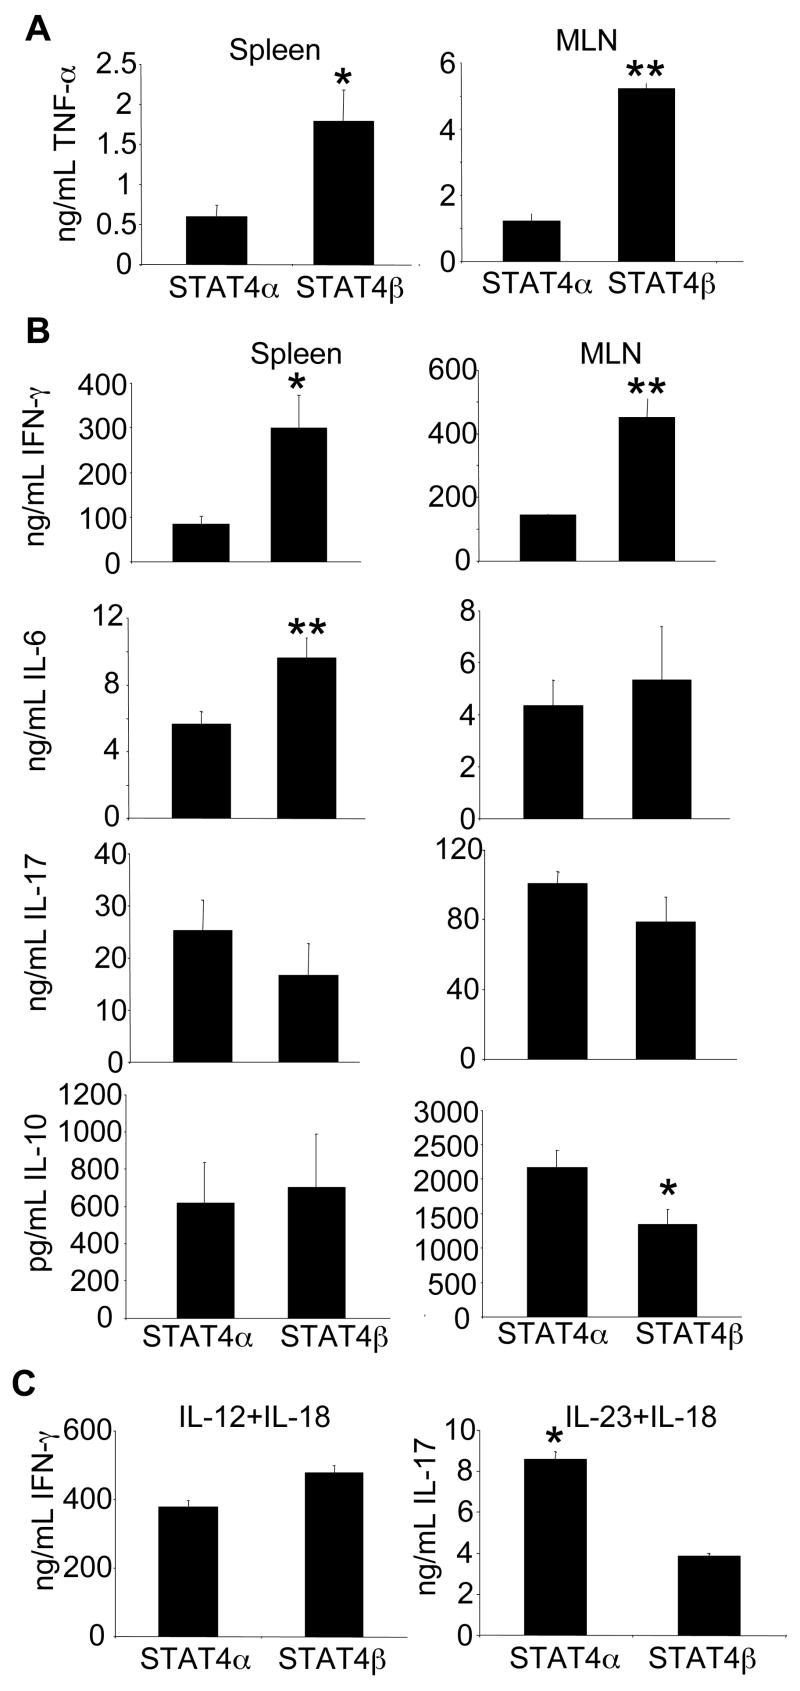
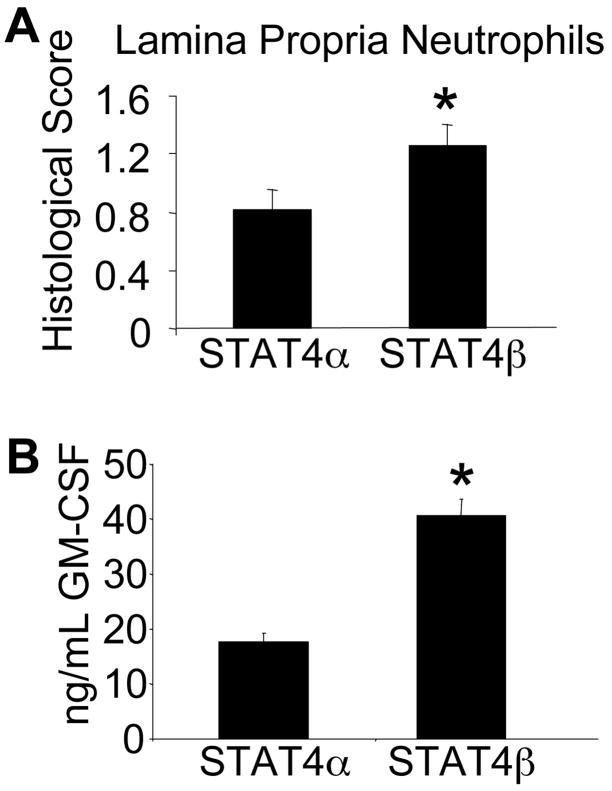
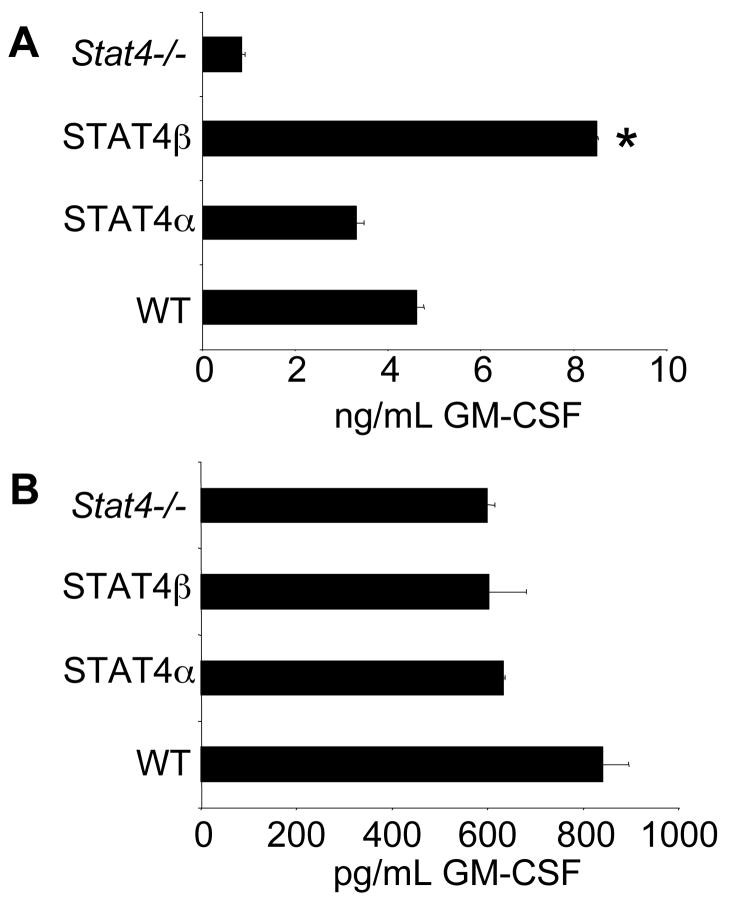
STAT4, a critical regulator of inflammation in vivo, can be expressed as two alternative splice forms, a full-length STAT4alpha, and a STAT4beta isoform lacking a C-terminal transactivation domain. Each isoform is sufficient to program Th1 development through both common and distinct subsets of target genes. However, the ability of these isoforms to mediate inflammation in vivo has not been examined. Using a model of colitis that develops following transfer of CD4(+) CD45RB(high) T cells expressing either the STAT4alpha or STAT4beta isoform into SCID mice, we determined that although both isoforms mediate inflammation and weight loss, STAT4beta promotes greater colonic inflammation and tissue destruction. This correlates with STAT4 isoform-dependent expression of TNF-alpha and GM-CSF in vitro and in vivo, but not Th1 expression of IFN-gamma or Th17 expression of IL-17, which were similar in STAT4alpha- and STAT4beta-expressing T cells. Thus, higher expression of a subset of inflammatory cytokines from STAT4beta-expressing T cells correlates with the ability of STAT4beta-expressing T cells to mediate more severe inflammatory disease.
Figures
Similar articles
-
Distinct requirements for the naturally occurring splice forms Stat4alpha and Stat4beta in IL-12 responses.EMBO J. 2003 Aug 15;22(16):4237-48. doi: 10.1093/emboj/cdg393. EMBO J. 2003. PMID: 12912921 Free PMC article.
-
Stat4 isoforms differentially regulate inflammation and demyelination in experimental allergic encephalomyelitis.J Immunol. 2008 Oct 15;181(8):5681-90. doi: 10.4049/jimmunol.181.8.5681. J Immunol. 2008. PMID: 18832727 Free PMC article.
-
Signal transducer and activation of transcription (STAT) 4beta, a shorter isoform of interleukin-12-induced STAT4, is preferentially activated by estrogen.Endocrinology. 2009 Mar;150(3):1310-20. doi: 10.1210/en.2008-0832. Epub 2008 Nov 6. Endocrinology. 2009. PMID: 18988675 Free PMC article.
-
STAT4 controls GM-CSF production by both Th1 and Th17 cells during EAE.J Neuroinflammation. 2015 Jun 30;12:128. doi: 10.1186/s12974-015-0351-3. J Neuroinflammation. 2015. PMID: 26123499 Free PMC article.
-
Altered STAT4 Isoform Expression in Patients with Inflammatory Bowel Disease.Inflamm Bowel Dis. 2015 Oct;21(10):2383-92. doi: 10.1097/MIB.0000000000000495. Inflamm Bowel Dis. 2015. PMID: 26177303 Free PMC article.
Cited by
-
Association of STAT4 rs7574865 with susceptibility to systemic lupus erythematosus in Iranian population.Inflammation. 2013 Dec;36(6):1548-52. doi: 10.1007/s10753-013-9698-8. Inflammation. 2013. PMID: 23912645
-
Abnormal genetic and epigenetic changes in signal transducer and activator of transcription 4 in the pathogenesis of inflammatory bowel diseases.Dig Dis Sci. 2012 Oct;57(10):2600-7. doi: 10.1007/s10620-012-2199-z. Epub 2012 May 9. Dig Dis Sci. 2012. PMID: 22569826
-
Impaired development of human Th1 cells in patients with deficient expression of STAT4.Blood. 2009 Jun 4;113(23):5887-90. doi: 10.1182/blood-2008-09-179820. Epub 2009 Apr 9. Blood. 2009. PMID: 19359411 Free PMC article.
-
Virus-specific CD4 and CD8 T cell responses in the absence of Th1-associated transcription factors.J Leukoc Biol. 2014 May;95(5):705-713. doi: 10.1189/jlb.0813429. Epub 2013 Nov 14. J Leukoc Biol. 2014. PMID: 24231259 Free PMC article.
-
STAT1β enhances STAT1 function by protecting STAT1α from degradation in esophageal squamous cell carcinoma.Cell Death Dis. 2017 Oct 5;8(10):e3077. doi: 10.1038/cddis.2017.481. Cell Death Dis. 2017. PMID: 28981100 Free PMC article.
References
-
- Glimcher LH, Murphy KM. Lineage commitment in the immune system: the T helper lymphocyte grows up. Genes Dev. 2000;14:1693–1711. - PubMed
-
- Mosmann TR, Coffman RL. TH1 and TH2 cells: different patterns of lymphokine secretion lead to different functional properties. Annu Rev Immunol. 1989;7:145–173. - PubMed
-
- Oppmann B, Lesley R, Blom B, Timans JC, Xu Y, Hunte B, Vega F, Yu N, Wang J, Singh K, Zonin F, Vaisberg E, Churakova T, Liu M, Gorman D, Wagner J, Zurawski S, Liu Y, Abrams JS, Moore KW, Rennick D, de Waal-Malefyt R, Hannum C, Bazan JF, Kastelein RA. Novel p19 protein engages IL-12p40 to form a cytokine, IL-23, with biological activities similar as well as distinct from IL-12. Immunity. 2000;13:715–725. - PubMed
-
- Aggarwal S, Ghilardi N, Xie MH, de Sauvage FJ, Gurney AL. Interleukin-23 promotes a distinct CD4 T cell activation state characterized by the production of interleukin-17. J Biol Chem. 2003;278:1910–1914. - PubMed
-
- Micallef MJ, Ohtsuki T, Kohno K, Tanabe F, Ushio S, Namba M, Tanimoto T, Torigoe K, Fujii M, Ikeda M, Fukuda S, Kurimoto M. Interferon-gamma-inducing factor enhances T helper 1 cytokine production by stimulated human T cells: synergism with interleukin-12 for interferon-gamma production. Eur J Immunol. 1996;26:1647–1651. - PubMed
Publication types
MeSH terms
Substances
Grants and funding
LinkOut - more resources
Full Text Sources
Other Literature Sources
Molecular Biology Databases
Research Materials
Miscellaneous
