. 2008 Oct;7(19):3037-47.
doi: 10.4161/cc.7.19.6736. Epub 2008 Oct 5.

Speedy/Ringo C regulates S and G2 phase progression in human cells

Affiliations

Speedy/Ringo C regulates S and G2 phase progression in human cells

Aiyang Cheng et al. Cell Cycle. 2008 Oct.

Abstract

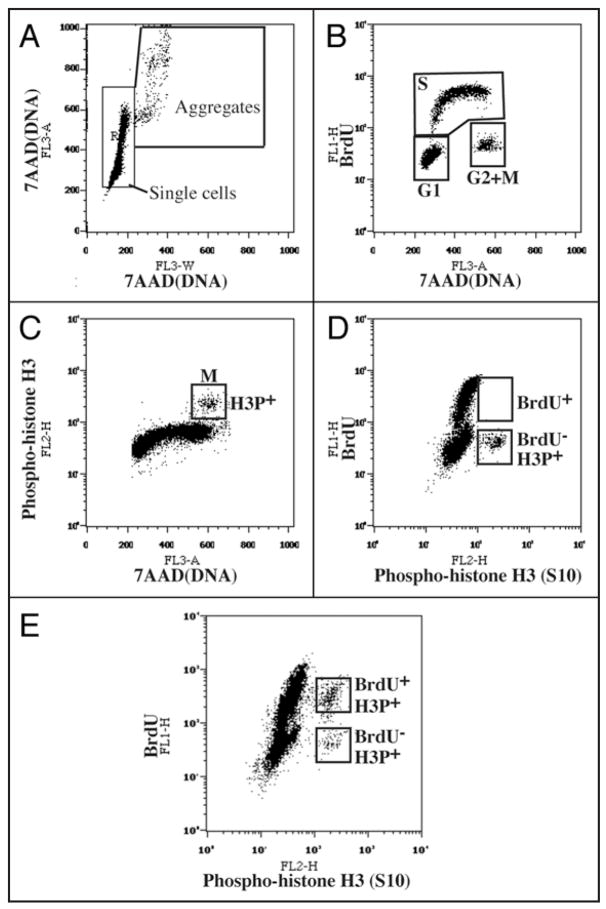
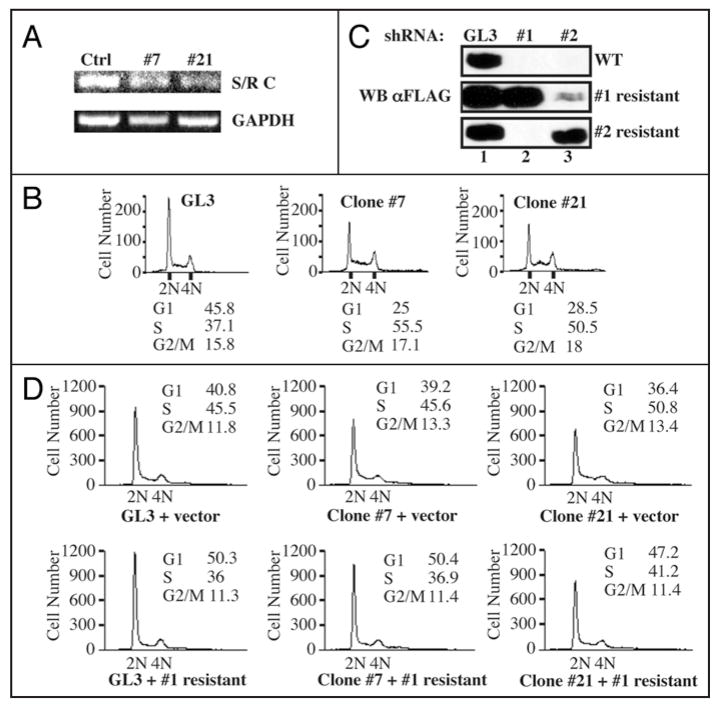
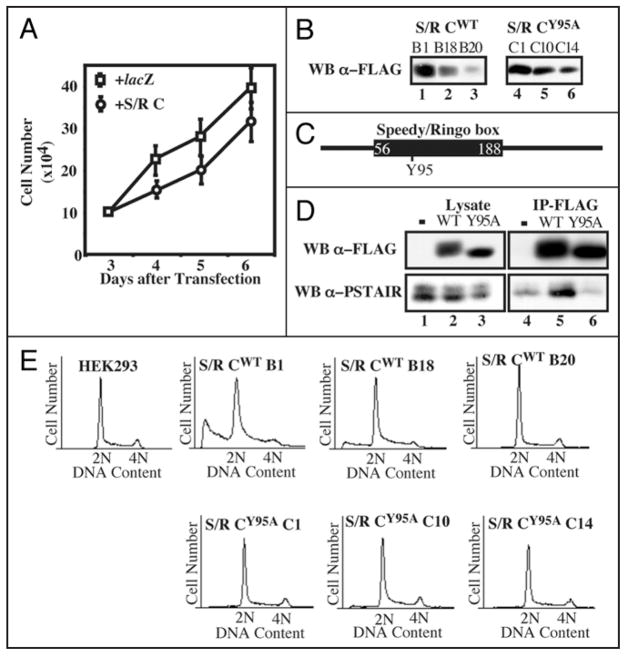
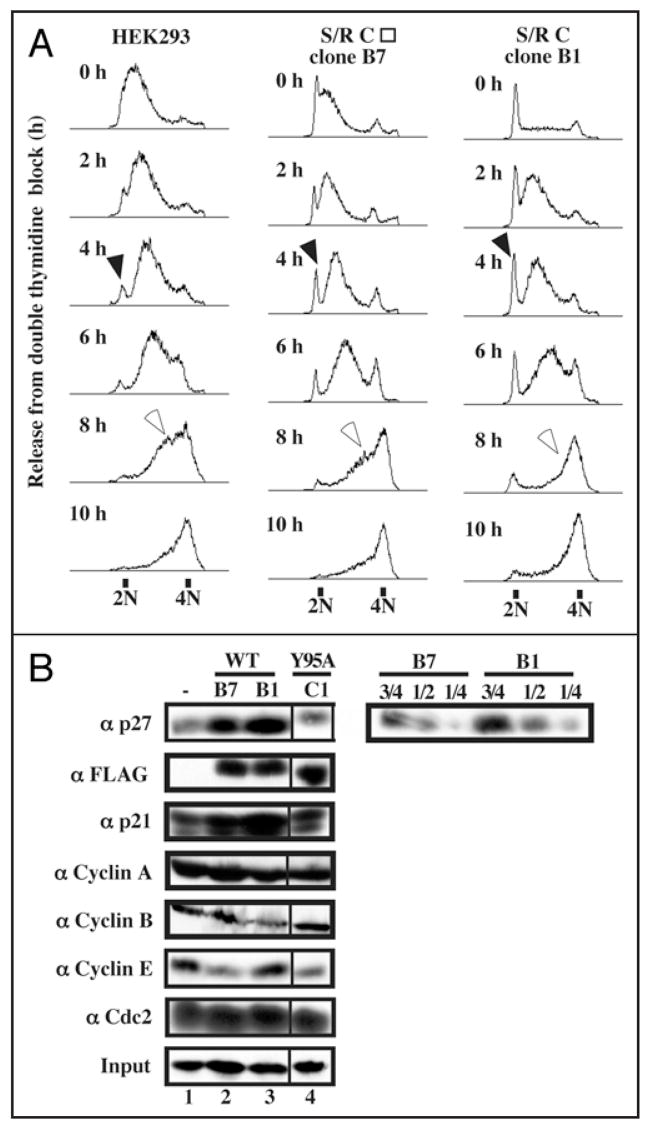
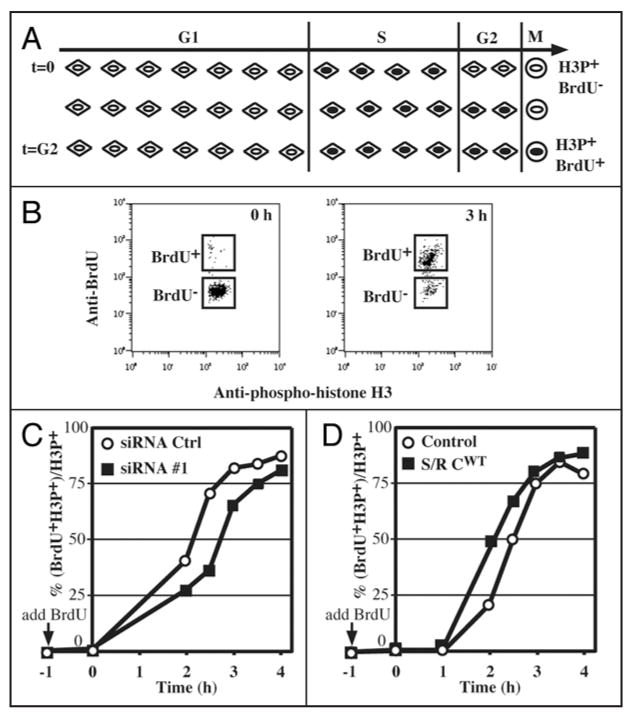
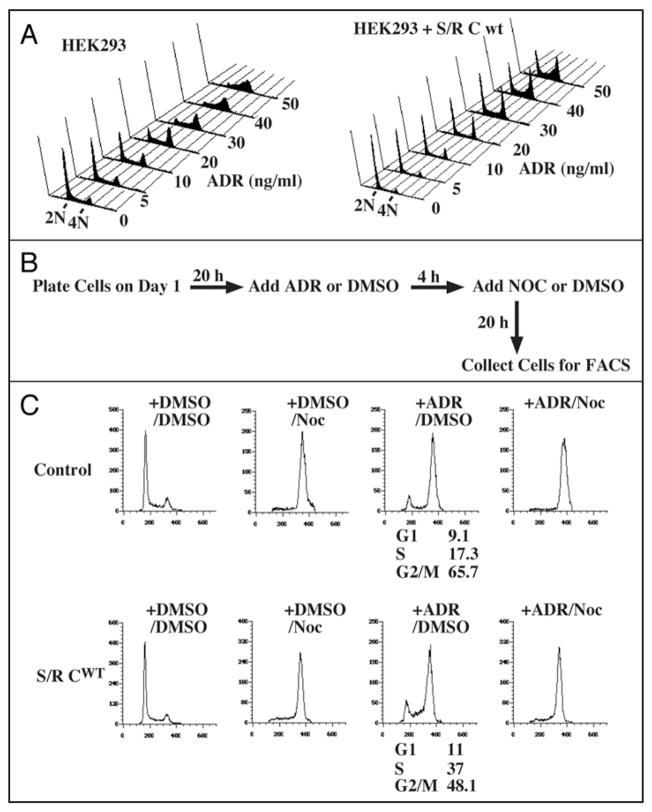
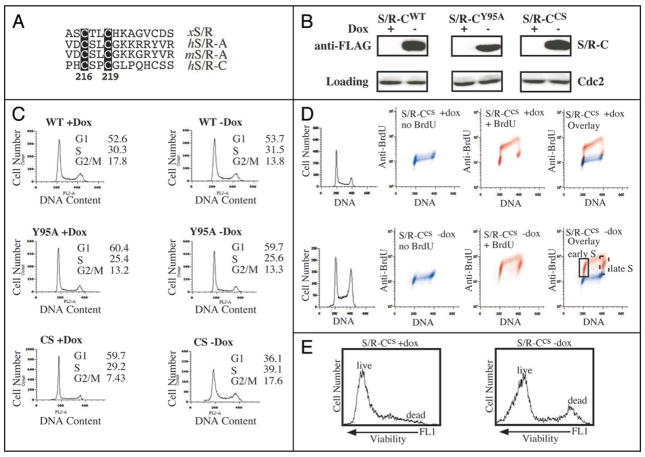
Cyclin-dependent kinases (CDKs) control cell cycle transitions and progression. In addition to their activation via binding to cyclins, CDKs can be activated via binding to an unrelated class of cell cycle regulators termed Speedy/Ringo (S/R) proteins. Although mammals contain at least five distinct Speedy/Ringo homologues, the specific functions of members of this growing family of CDK activators remain largely unknown. We investigated the cell cycle roles of human Speedy/Ringo C in HEK293 cells. Down-regulation of Speedy/Ringo C by RNA interference delayed S and G(2) progression whereas ectopic expression had the opposite effect, reducing S and G(2)/M populations. Double thymidine arrest and release experiments showed that overexpression of Speedy/Ringo C promoted late S phase progression. Using a novel three-color FACS protocol to determine the length of G(2) phase, we found that the suppression of Speedy/Ringo C by RNAi prolonged G(2) phase by approximately 30 min whereas ectopic expression of Speedy/Ringo C shortened G(2) phase by approximately 25 min. In addition, overexpression of Speedy/Ringo C disrupted the G(2) DNA damage checkpoint, increased cell death and caused a cell cycle delay at the G(1)-to-S transition. These observations indicate that CDK-Speedy/Ringo C complexes positively regulate cell cycle progression during the late S and G(2) phases of the cell cycle.


Figures

Figure 1
Figure 1
Reduction of Speedy/Ringo C by siRNA delays cell cycle progression through S and G2 phase. (A) Analysis of human Speedy/Ringo C and GAPDH expression in human cell lines by RT-PCR. RT-PCR was performed with total RNAs isolated from K562 (lane 1), HEK293 (lane 2), HeLa (lane 3), and A549 (lane 4) cells using PCR primers to Speedy/Ringo C (top) and GAPDH (bottom). (B) Inhibition of human Speedy/Ringo C expression in HEK293 cells by siRNAs. The expression of Speedy/Ringo C (top) and GAPDH (bottom) was analyzed by RT-PCR with total RNAs isolated from cells transfected with control siRNA (GL3) against firefly luciferase (lane 1), siRNA #1 against Speedy/Ringo C (lane 2), and siRNA #2 against Speedy/Ringo C (lane 3). (C) Reduction of Speedy/Ringo C inhibited cell growth. HEK293 cells were transfected with either control siRNA (GL3) or siRNAs against Speedy/Ringo C. The number of viable cells was measured at different times by trypan blue exclusion. Values represent the means ± S.E. from three separate experiments. (D) Downregulation of Speedy/Ringo C delayed cell cycle progression during S and G2 phases. HEK293 cells were transfected with control siRNAs (GL3) or siRNA #1 against Speedy/Ringo C. Cells were harvested after 48-h, fixed, and processed as described in EXPERIMENTAL PROCEDURES. DNA content was measured by flow cytometry after propidium iodide staining (panels). The percentages of cells in the different phases of the cell cycle were determined by using the Watson Pragmatic model in the FlowJo program (“Modeled”). To measure cell cycle distributions in the four cell cycle phases directly (“Measured”), cells were labeled with 10 μM BrdU for 1 h and processed for triple color FACS (DNA content, BrdU incorporation, staining with anti-phospho-histone H3) as described in EXPERIMENTAL PROCEDURES (see also Fig. 2). The actual durations of the cell cycle phases were calculated based on the measured cell cycle distributions and the length of G2 phase determined in Figure 6C.
Figure 2
Figure 2
Flow cytometry analysis of cell cycle parameters after triple staining for BrdU incorporation (S phase cells), phosphohistone H3Ser10 (mitotic cells) and 7-AAD (DNA content). (A) Doublet discrimination was performed with 7-AAD fluorescence (FL3). Single cell events were distinguished from cell aggregates on a FL3-A vs. FL3-W plot of 7-AAD fluorescence. The FL3-A (“area”) value represents the total fluorescent intensity of an event whereas the FL3-W (“width” or “transit time”) represents the width of the fluorescent entity as it passes through the detector. Thus, events with larger values of FL3-W represent cell aggregates containing higher amounts of DNA (FL3-A). This plot is particularly useful for distinguishing, for instance, individual G2 cells from pairs of G1 cells. Only cells in the “Single cells” box were used for further analysis. (B) A BrdU incorporation vs. 7-AAD plot distinguishes cells in G1, S and G2/M. (C) An anti-phosphohistone H3Ser10 (mitotic cells) vs. 7-AAD plot distinguishes G2 cells from mitotic cells. (D and E) Measuring the duration of G2. Cells were incubated with BrdU and fixed and processed immediately (D) or after three hours (E). The anti-BrdU vs. anti-phosphohistone H3Ser10 plot distinguishes mitotic (H3P+) cells that have incorporated BrdU (i.e., that have had enough time to traverse G2) from those that do not contain BrdU and that have not yet had time to traverse G2. For details, see EXPERIMENTAL PROCEDURES.
Figure 3
Figure 3
Ectopic expression of RNAi-resistant forms of Speedy/Ringo C rescued the S and G2 delays caused by RNAi-knockdown of Speedy/Ringo C. (A) Analysis of Speedy/Ringo C and GAPDH expression in HEK293 clones expressing shRNA against firefly luciferase (Ctrl) and shRNA #1 against Speedy/Ringo C (clones #7 and #21) by RT-PCR. HEK293 cells were transfected with plasmids expressing shRNA and stable clones were selected against zeocin as described in EXPERIMENTAL PROCEDURES. The expression of Speedy/Ringo C (top) and GAPDH (bottom) were determined by RT-PCR. (B) The cell cycle distributions of HEK293 clones expressing mock shRNA (GL3) or shRNA #1 against Speedy/Ringo C (clone #7 and clone #21) were analyzed by FACS. DNA content was measured by flow cytometry of propidium iodide-stained cells. The percentage of cells in different phases of the cell cycle was determined using the Watson Pragmatic model in the FlowJo program. (C) Characterization of RNAi-resistant forms of Speedy/Ringo C. HEK293 cells were cotransfected with vectors expressing the GL3 control shRNA (lane 1) or with shRNA #1 (lane 2) or shRNA #2 (lane 3) against Speedy/Ringo C plus the indicated 3xFLAG-Speedy/Ringo C expression plasmid (WT, resistant to shRNA #1, or resistant to shRNA #2). The resistant Speedy/Ringo C constructs contained silent mutations rendering them resistant to the corresponding shRNAs. The expression of Speedy/Ringo C was analyzed by immunoblotting after 48 h. (D) Expression of RNAi-resistant Speedy/Ringo C rescued the cell cycle delay caused by Speedy/Ringo C knockdown. HEK293 clones expressing shRNA against firefly luciferase (GL3, left) and Speedy/Ringo C #1 (clones #7 and #21) were transfected with either empty vector (“vector”) or with shRNA #1-resistant 3xFLAG-Speedy/Ringo C. The cell cycle distributions of transfected cells were analyzed by flow cytometry.
Figure 4
Figure 4
Effects of overexpression of Speedy/Ringo C on cell growth and the cell cycle. (A) Ectopic expression of Speedy/Ringo C inhibited cell growth. HEK293 cells were transfected with plasmids encoding lacZ or 3xFLAG-Speedy/Ringo C. The cell number was measured at different times. Values represent the means ± S.E. from three separate experiments. (B) Isolation of HEK293 clones expressing different levels of Speedy/Ringo CWT or Speedy/Ringo CY95A. HEK293 cells were transfected with pcDNA3-3xFLAG-Speedy/Ringo CWT and pcDNA3-3xFLAG-Speedy/Ringo CY95A. Stable clones were selected using G418 and cell lysates were immunoblotted for 3xFLAG-Speedy/Ringo C. (C) Schematic illustration of the conserved Speedy/Ringo box and the position of Tyr-95 in Speedy/Ringo C. (D) The Speedy/Ringo C Y95A mutant was unable to interact with CDKs. HEK293 cells were lysed 48 hours after transfection with pcDNA3, pcDNA3-3xFLAG-Speedy/Ringo CWT, and pcDNA3-3xFLAG-Speedy/Ringo CY95A. Cell lysates were immunoprecipitated with anti-FLAG M2 agarose. Cell lysates (lanes 1–3) and immunoprecipitates (lanes 4–6) were analyzed by immunoblotting with antibodies against FLAG to detect Speedy/Ringo C (top) and PSTAIRE to detect Cdc2 and Cdk2 (bottom). (E) DNA content in HEK293 cells and selected clones from (D) was determined by flow cytometry of propidium iodide-stained cells.
Figure 5
Figure 5
Overexpression of Speedy/Ringo C slowed the G1-to-S transition and promoted rapid progression through late S phase. (A) HEK293 cells and two Speedy/Ringo C-expressing clones (B1 and B7, whose Speedy/Ringo C level was slightly lower than that of clone B1) were synchronized by a double thymidine block protocol. The cells were released from the thymidine block into medium containing nocodazole and harvested at the indicated times. Cell cycle distributions were analyzed by flow cytometry of propidium iodide-stained cells. Cells delayed at the G1/S boundary are indicated with solid arrowheads; cells in late S phase are indicated with open arrowheads. (B) Immunoblotting analysis of cell cycle regulators in HEK293 cells (lane 1), Speedy/Ringo CWT clone B7 (lane 2), clone B1 (lane 3), and Speedy/Ringo CY95A clone C1 (lane 4). Serial dilutions of proteins from Speedy/Ringo CWT clones B1 and B7 were made to facilitate quantitation of p27 levels between HEK293 cells and Speedy/Ringo CWT clones. Note that the lane 4 samples in the left-hand panels are from a different part of the same autoradiographs as lanes 1–3.
Figure 6
Figure 6
Speedy/Ringo C controls G2 length and the G2/M transition. (A) Diagram of the strategy to measure the length of G2 phase. Asynchronous cells were incubated with 10 μM BrdU to label S phase cells. Samples were taken at various times and processed to detect BrdU, phosphohistone H3Ser10 (HH3P; mitotic marker), and DNA content by flow cytometry. Initially, all HH3P-positive cells (HH3P+) are BrdU-negative (BrdU-). As BrdU-labeled cells pass through G2 and enter into mitosis, an increasing fraction of HH3P-positive cells become BrdU-positive (BrdU+). The length of G2 phase was defined as the time until half of the HH3P-positive cells are also BrdU-positive. (B) Plots of BrdU-positive vs. HH3P-positive cells. See EXPERIMENTAL PROCEDURES and Figure 2 for details of this analysis. Representative examples of such plots at times 0 h and 3 h are shown. (C) Analysis of G2 length in HEK293 cells treated with siRNA control (GL3, open circle ○) siRNA #1 against Speedy/Ringo C (solid square ▪). Cells were labeled with BrdU two days following transfection, harvested at the indicated times, and processed for flow cytometry as described above. The percent-age of HH3P+ cells that were also BrdU+ was plotted against time. (D) Analysis of G2 length in HEK293 cells overexpressing Speedy/Ringo C. HEK293 control cells (open circle ○) and cells overexpressing Speedy/Ringo C (clone B1, solid square ▪) were labeled with BrdU, and analyzed as in (C).
Figure 7
Figure 7
Ectopic expression of Speedy/Ringo C can suppress the DNA damage checkpoint. (A) Effects of Adriamycin (ADR) on HEK293 cells and Speedy/Ringo C-expressing cells. HEK293 cells and Speedy/Ringo C clone B1 were treated with the indicated concentrations of ADR for 18 h. Cells were harvested, stained with propidium iodide, and subjected to FACS. (B) Diagram of Adriamycin/nocodazole experiments to assess the ability of cells to overcome the DNA damage checkpoint. Cells were treated with either mock (DMSO) or ADR for 4 hours, then treated with mock or nocodazole (Noc) for an additional 20 hours to block cell cycle progression at mitosis. (C) Overexpression of Speedy/Ringo C overcame the G2 DNA damage checkpoint induced by ADR. HEK293 cells and Speedy/Ringo C clone B1 were treated with 30 ng/ml ADR and/or 50 ng/ml Noc as described above. Cells were harvested and analyzed by FACS. Data were plotted as cell number vs. DNA content. The percentage of cells in different phases of the cell cycle was determined using the Watson Pragmatic model in the FlowJo program. All G1 and S phase cells following ADR treatment resulted from passage through the G2 DNA damage checkpoint (compare third panels on each row with the fourth panels).
Figure 8
Figure 8
Overexpression of Speedy/Ringo CCS induces an embryonic cell-like cell cycle in HeLa cells. (A) Illustration of the conserved CxxC motif in Speedy/Ringo proteins. Numbers denote the position of the CxxC in human Speedy/Ringo C. (B) Expression of FLAG-tagged Speedy/Ringo CWT, Speedy/Ringo CY95A and Speedy/Ringo CCS in HeLa Tet-Off cells. Transiently transfected cells were grown in the presence (Off) or the absence (On) of doxycycline for three days. The expression of Speedy/Ringo C was detected by immunoblotting. (C) Cell cycle profiles of HeLa cells expressing Speedy/Ringo proteins. Cells were grown as described in (B) above. Cell cycle profiles were determined by FACS after cells were stained with propidium iodide. (D) Cell cycle profiles of HeLa cells expressing Speedy/Ringo CCS were measured by BrdU incorporation. HeLa Tet-Off cells expressing Speedy/Ringo CCS were grown in the presence (Off) or the absence (On) of doxycycline for three days and then incubated for one hour with either BrdU (red) to label replicating DNA or with PBS (blue) as a negative control. Samples were stained with anti-BrdU antibodies and propidium iodide. The overlap between BrdU-negative (blue) and BrdU-positive (red) signals indicates cells that did not undergo DNA replication during the labeling period and hence were in G1, G2 and M. Red (BrdU-positive) signals that did not overlap with the blue (BrdU-negative) signals indicate that the majority of cells underwent DNA replication (S phase) and very few cells were in G1 and G2. (E) Effect of Speedy/Ringo CCS expression on cell viability. Viabilities of the cells in (D) were measured with a LIVE/DEAD fixable green dead cell stain kit from Invitrogen, Inc. Samples were incubated with fluorescent reactive dye for 30 min on ice, then cells were fixed and processed prior to FACS analyses. Dead cells have strong signals in the FL1 (green fluorescence) channel. 10,000 cells were analyzed for each sample.

Similar articles

Cited by

References

    1. Pines J. Cyclins and cyclin-dependent kinases: a biochemical view. Biochem J. 1995;308:697–711. - PMC - PubMed
    1. Sherr CJ, Roberts JM. Inhibitors of mammalian G1 cyclin-dependent kinases. Genes Dev. 1995;9:1149–63. - PubMed
    1. Sherr CJ, Roberts JM. CDK inhibitors: positive and negative regulators of G1-phase progression. Genes Dev. 1999;13:1501–12. - PubMed
    1. King RW, Deshaies RJ, Peters JM, Kirschner MW. How proteolysis drives the cell cycle. Science. 1996;274:1652–9. - PubMed
    1. Morgan DO. The dynamics of cyclin dependent kinase structure. Curr Opin Cell Biol. 1996;8:767–72. - PubMed

Publication types

LinkOut - more resources