. 2008 Oct;118(10):3390-402.
doi: 10.1172/JCI35449.

CTLs are targeted to kill beta cells in patients with type 1 diabetes through recognition of a glucose-regulated preproinsulin epitope

Affiliations

CTLs are targeted to kill beta cells in patients with type 1 diabetes through recognition of a glucose-regulated preproinsulin epitope

Ania Skowera et al. J Clin Invest. 2008 Oct.

Erratum in

  • J Clin Invest. 2009 Sep;119(9):2844. Unger, Wendy [corrected to Unger, Wendy W]

Abstract

The final pathway of beta cell destruction leading to insulin deficiency, hyperglycemia, and clinical type 1 diabetes is unknown. Here we show that circulating CTLs can kill beta cells via recognition of a glucose-regulated epitope. First, we identified 2 naturally processed epitopes from the human preproinsulin signal peptide by elution from HLA-A2 (specifically, the protein encoded by the A*0201 allele) molecules. Processing of these was unconventional, requiring neither the proteasome nor transporter associated with processing (TAP). However, both epitopes were major targets for circulating effector CD8+ T cells from HLA-A2+ patients with type 1 diabetes. Moreover, cloned preproinsulin signal peptide-specific CD8+ T cells killed human beta cells in vitro. Critically, at high glucose concentration, beta cell presentation of preproinsulin signal epitope increased, as did CTL killing. This study provides direct evidence that autoreactive CTLs are present in the circulation of patients with type 1 diabetes and that they can kill human beta cells. These results also identify a mechanism of self-antigen presentation that is under pathophysiological regulation and could expose insulin-producing beta cells to increasing cytotoxicity at the later stages of the development of clinical diabetes. Our findings suggest that autoreactive CTLs are important targets for immune-based interventions in type 1 diabetes and argue for early, aggressive insulin therapy to preserve remaining beta cells.


Figures

Figure 1
Figure 1. Generation of surrogate β cell lines and examination of their naturally processed and presented peptide repertoire.
The chronic myelogenous leukemia cell line K562 was variously transfected with the genes for PPI and HLA-A*0201. (A) This yielded cell lines (denoted K562-PPI and K562-PPI-A2) that secrete proinsulin (gray bars) and immunoreactive insulin species (black bars) into cell culture supernatants. No proinsulin or immunoreactive insulin is secreted by single-transfected K562-A2 cells. Bars represent mean levels present in cell supernatants and error bars the SEM. (B) Surface HLA-A2 expression was examined by flow cytometry using the allele-specific mAb BB7.2, showing comparable HLA-A2 levels on the K562-A2 (solid line) and K562-PPI-A2 (dashed line) cells compared with absence of staining on K562-PPI cells (dotted line). Isotype control staining was similar to K562-PPI staining on all cell lines, and similar results were obtained with the pan–HLA-A,B,C–staining mAb W6/32. K562-PPI-A2 and K562-A2 cell lines were grown in large cultures and the natural peptide repertoire extracted and resolved by RP-HPLC, and fractions were compared by MS to identify masses unique to PPI-expressing cells. (C and D) MS analysis of HPLC fractions 55 and 65, respectively, from K562-PPI-A2 cells. Arrows indicate masses unique to these cells (784.37 and 968.48 m/z, respectively) that are not found in the equivalent (or adjacent) fractions from K562-A2 cells (E and F) or K562-PPI cells (data not shown).
Figure 2
Figure 2. Mass spectrometry analysis of unique eluted masses.
MS/MS analysis of the unique masses using collision-induced dissociation (CID) reveals their identity. Plots show fragmentation patterns of the 784.37 m/z (A) and 968.48 m/z (B) species under CID in atmospheric gas, revealing a series of ions (y, b, and a) and fragments (PD/DP, GPD, and GPDPA) that identify the parent ions as WGPDPAAA (PPI17–24, predicted monoisotopic mass, 784.3624 Da) and ALWGPDPAAA (PPI15–24, predicted monoisotopic mass, 968.4836 Da), respectively. These sequences map to the SP of PPI. These results, from the starting cellular material onward, were replicated in a further 2 independent experiments. (C) Representation of the SP region of PPI and beginning of the B chain of insulin. Both eluted peptides terminate at residue 24, the signal peptidase cleavage site. The transmembrane region of SP is shown, as predicted from SignalP-HMM (51) and Kyte-Doolittle (52) hydrophobicity plots, and indicates that residue 17 is immediately after the transmembrane segment, while the NH2 terminus of PPI15–24 commences in the intramembrane segment.
Figure 3
Figure 3. Circulating effector CD8+ T cells that recognize PPI SP epitopes are present in patients with type 1 diabetes.
IFN-γ ELISPOT PBMC reactivity to PPI15–24, either PPI17–24 or PPI15–24, or both peptides was significantly more frequent in patients with type 1 diabetes and HLA-A*0201 (black bars) than in HLA-matched nondiabetic control subjects (white bars). Responses to PPI17–24 were not significantly different in this series (P = 0.08), but see Supplemental Table 1 showing a similar analysis of an extended, independent series of cases in which the prevalence of responses to PPI17–24 is significantly higher in patients with type 1 diabetes than in control subjects (P = 0.004). In contrast, the prevalence of responses to the mixture of viral peptides was similar in the 2 groups (see also Supplemental Table 1).
Figure 4
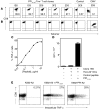
Figure 4. Generation of CD8+ T cell clones specific for PPI SP epitope PPI15–24.
(A) Five clones isolated from a patient with type 1 diabetes stained with anti-CD8 and HLA-A2 tetramers loaded with PPI15–24. Tetramer-stained cells were detected in the upper-right quadrant. A CD8+ T cell clone obtained in the same expansion that was negative for PPI15–24–Tmr (3C9) and a clone (2D9) raised against the CMV pp65 epitope NLVPMVATV are shown. (B) Staining of the same clones with HLA-A2 tetramers loaded with the CMV pp65 epitope NLVPMVATV. (C) PPI15–24–specific T cell clones produce TNF-α in a dose-dependent fashion, shown here as the percentage of 1E6 clone cells staining for intracellular cytokine in response to HLA-A2+ PBMCs pulsed with varying concentrations of PPI15–24. (D) 1E6 clone cells proliferate in response to PPI15–24 peptide-pulsed monocyte-derived DCs, as measured by [3H]thymidine incorporation. No response was observed using antigen-presenting cells lacking HLA-A2 (data not shown). (E) 1E6 clone cells also recognize the PPI15–24 epitope when naturally processed by K562-PPI-A2 cells, since no TNF-α was produced after coculture with K562-A2 cells, but in the presence of PPI15–24 peptide-pulsed K562-A2 (1 μg/ml) or K562-PPI-A2 cells, copious amounts of cytokine were produced. Isotype control staining was similar to control-activated clone cells. Proliferation assays were performed in triplicate; bars represent means, error bars are SEMs. Values inside flow cytometry quadrants indicate percentage of positive cells. Data are representative of more than 5 individual experiments.
Figure 5
Figure 5. CD8+ T cell clones specific for PPI SP epitope PPI15–24 are cytotoxic and kill human β cells.
(A) Percent specific lysis of K562-PPI-A2 cells by 1E6 PPI15–24–specific T cell clone (open squares) but not K562-A2 (triangles) or K562-PPI cells (data not shown). Control CTL 2D9 recognizing A2-presented CMV pp65495–503 does not kill K562-PPI-A2 cells (open circles). Both clones kill K562-A2 and K562-PPI-A2 cells prepulsed with respective cognate peptide (lysis >90% at 25:1 effector/target ratio; data not shown). (B) Lysis of human HLA-A2+ (open squares) islet cells by 1E6. A2-negative islet cells (triangles) were not killed, and there was no killing by 2D9 (open circles). A2+ (but not HLA-A2) islet cells prepulsed with PPI15–24 were killed (lysis >90% at 25:1; data not shown). Representative of 5 assays for K562 and 3 for human islets (including 2 different donors), performed in triplicate (data are presented as mean, with error bars representing SEMs). (C) Representative (from 3 independent experiments) agarose gel resolution of semiquantitative RT-PCR amplification from human islet cell cytotoxicity assays using insulin- and glucagon-specific primers. (D) PCR product density relative to β-actin (IOD, integrated optical density). A greater than 4-fold reduction in insulin mRNA when islet cells were cultured with 1E6 PPI15–24–specific CTLs is seen (lane 2; IOD, 50.0 × 10³), compared with no added clone (lane 1; IOD, 202.0 × 10³). No reduction in insulin expression is seen in the presence of 2D9 (lane 3). Glucagon expression is similar under all conditions, indicating that killing of human islet cells by 1E6 PPI15–24–specific CTLs is β cell specific.
Figure 6
Figure 6. Generation of SP epitopes of PPI is independent of TAP.
(A) To examine TAP dependency of PPI15–24 presentation by K562 cells, the CTL clone (1E6) recognizing PPI15–24 restricted by HLA-A2 was used in cytotoxicity assays in the presence of the varicellovirus-derived TAP inhibitor UL49.5 (19). As a control, we used the HA-2 CTL clone 5H17 (53), specific for an endogenously expressed, TAP-dependent minor histocompatibility antigenic epitope (sequence YIGEVLVSV derived from a diallelic gene encoding a novel human class I myosin protein) presented by HLA-A2 (54). Target cells for clone 1E6 were K562-PPI-A2 cells or K562-PPI-A2 cells additionally transfected to express UL49.5. Target cells for clone 5H17 were K562-A2 cells or K562-A2 cells additionally transfected to express UL49.5. Data are expressed as percent killing (see Methods for calculation of specific cytotoxicity using DELFIA assay); bars represent means and error bars, SEMs. In the presence of the 1E6 PPI15–24–specific CTLs, killing of K562-PPI-A2 cells cotransfected with UL49.5 (black bars) was comparable to that of untransfected K562-PPI-A2 cells (white bars), indicating that TAP inhibition by UL49.5 does not reduce PPI15–24 presentation. In contrast, killing of target cells by the HA-2–specific CTL 5H17 that recognizes a TAP-dependent epitope is markedly inhibited in the presence of UL49.5 (black bars). (B) To examine proteasome dependency of PPI15–24 generation, MS analyses of immuno- and constitutive proteasome digests of PPI1–30 were performed. Results are shown in Table 2. In the same experiment, several other fragments of PPI1–30 were generated by proteasome digestion. Sequences marked with an asterisk were generated by the constitutive proteasome only. For reference, the 10-mer PPI15–24 peptide eluted from surrogate β cells is indicated by the black rectangle.
Figure 7
Figure 7. High ambient glucose increases β cell PPI synthesis and activation of PPI SP epitope PPI15–24–specific CTLs and the efficiency of human β cell killing.
(A) Agarose gel showing resolution of products of semiquantitative RT-PCR amplification using insulin- and glucagon-specific primers from total RNA extracted from human islet cells cultured for 14 hours in the presence of 5.6, 11, and 20 mM glucose. Results show increasing insulin mRNA synthesis with increasing glucose concentration. (B) Expressed relative to the density of the β-actin gene PCR product, insulin expression is greater than 4-fold higher at 20 mM compared with 5.6 mM glucose. There is an expected reduction (~2-fold) in glucagon expression at 20 mM compared with 5.6 mM glucose due to the known suppression of glucagon secretion by high glucose and insulin concentrations (–57). (C) Coculture of islet cells at different glucose concentrations with 1E6 PPI15–24–specific T cell clone results in a significant increase (1-way ANOVA, P < 0.01) in TNF-α production by the clone, with a significant linear trend as glucose concentration increases (P < 0.005), indicating an increase in epitope presentation at higher glucose concentration. (D) A similar analysis of islets precultured at different glucose concentrations and prepulsed with PPI15–24 peptide shows that high glucose alone has no effect on T cell clone activation. Symbols indicate different effector/target ratios of 3:1 (circles), 6:1 (diamonds), 12:1 (inverted triangles), and 25:1 (triangles).
Figure 8
Figure 8. High ambient glucose increases the efficiency of human β cell killing.
(A) Specific lysis of human islet cells after 14 hours preculture at different glucose concentrations (5.6 mM, 11 mM, and 20 mM; filled squares, filled circles, and open squares, respectively). Higher glucose results in significantly enhanced CTL killing by 1E6 (1-way ANOVA, P < 0.005; significant linear trend, P < 0.005). Representative agarose gel of RT-PCR amplification using insulin- and glucagon-specific primers of total RNA from human islet cells after 14 hours at different glucose concentrations (B) and band density in the same gel (C). Islet cells at 5.6, 11, and 20 mM glucose exposed to killing by 1E6 clone cells show increasing loss of insulin mRNA, declining from approximately 50,000 to approximately 0 counts. Glucagon expression is identical to that at 20 mM glucose in the absence of 1E6 clone cells (see Figure 7A). (D) In contrast, human islet cells pulsed with PPI15–24 show no β cell specificity of killing and no additive killing at higher glucose concentrations (symbols as above). (E) Agarose gel of RT-PCR using insulin- and glucagon-specific primers after human islet cells were cultured for 14 hours at 20 mM glucose, either with PPI15–24 peptide and exposed to killing by 1E6 (lane 1) or cultured alone (lane 2) and (F) graphical representation of band density. The results show loss of both insulin and glucagon expression, demonstrating a lack of β cell–specific killing of islets prepulsed with PPI15–24. Cytotoxicity assays were performed in triplicate; symbols represent means, and error bars represent SEMs.
Figure 9
Figure 9. Enhanced islet killing at high glucose concentration is related to translation of insulin mRNA rather than insulin secretion.
Analysis of islet cell killing in relation to insulin secretion and insulin mRNA expression. Human A2+ islets were cultured for the specified time periods in the presence of 20 mM glucose, and at the end of that time, islet cells were removed into a cytotoxicity assay with clone 3F2. White bars show insulin secretion over the periods 0–1 hours, 1–8 hours, and 8–16 hours. Gray bars show insulin mRNA expression above baseline (designated 1,000 AU, measured as IOD) in islets harvested at the specified time points. The line graph with open circles shows killing of islets harvested at the specified time points. The results show that β cells exposed to high glucose degranulate rapidly but that this is not related to enhanced killing by PPI15–24–specific CTLs. The relationship between insulin mRNA levels and killing suggests that PPI15–24 generation is related to levels of PPI transcription and translation rather than to insulin secretion.
Figure 10
Figure 10. PPI SP epitope PPI15–24 is cross-presented by DCs from intact PPI and PPI-expressing cells.
(A) DCs pulsed with soluble PPI and then matured induce TNF-α production by 1E6 PPI15–24–specific T cells. Cytokine production in the presence of a control protein (the fusion partner of recombinant human PPI) and PPI15–24 peptide are shown for comparison. (B) DCs pulsed with freeze-thawed K562 cells expressing PPI (K562-PPI) and then matured induce TNF-α production by 1E6 clone cells. Cytokine production in the presence of control cells (nontransfected K562) and PPI15–24 peptide are shown for comparison. Bars represent means from triplicate experiments, error bars SEMs; data are representative of 3 independent experiments.

Comment in

References

    1. Cnop M., et al. Mechanisms of pancreatic beta-cell death in type 1 and type 2 diabetes: many differences, few similarities. Diabetes. 2005;54(Suppl. 2):S97–S107. - PubMed
    1. Liblau R.S., Wong F.S., Mars L.T., Santamaria P. Autoreactive CD8 T cells in organ-specific autoimmunity: emerging targets for therapeutic intervention. Immunity. 2002;17:1–6. doi: 10.1016/S1074-7613(02)00338-2. - DOI - PubMed
    1. Bottazzo G.F., et al. In situ characterization of autoimmune phenomena and expression of HLA molecules in the pancreas in diabetic insulitis. N. Engl. J. Med. 1985;313:353–360. - PubMed
    1. Hanninen A., et al. Macrophages, T cell receptor usage, and endothelial cell activation in the pancreas at the onset of insulin-dependent diabetes mellitus. J. Clin. Invest. 1992;90:1901–1910. doi: 10.1172/JCI116067. - DOI - PMC - PubMed
    1. Somoza N., et al. Pancreas in recent onset insulin-dependent diabetes mellitus. Changes in HLA, adhesion molecules and autoantigens, restricted T cell receptor V beta usage, and cytokine profile. J. Immunol. 1994;153:1360–1377. - PubMed

Publication types

MeSH terms