. 2008 Oct;118(10):3420-30.
doi: 10.1172/JCI36030.

Regulatory B cells inhibit EAE initiation in mice while other B cells promote disease progression

Affiliations

Regulatory B cells inhibit EAE initiation in mice while other B cells promote disease progression

Takashi Matsushita et al. J Clin Invest. 2008 Oct.

Abstract

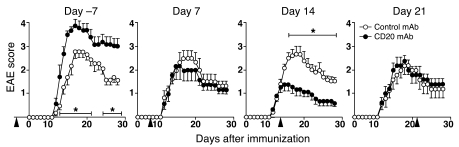
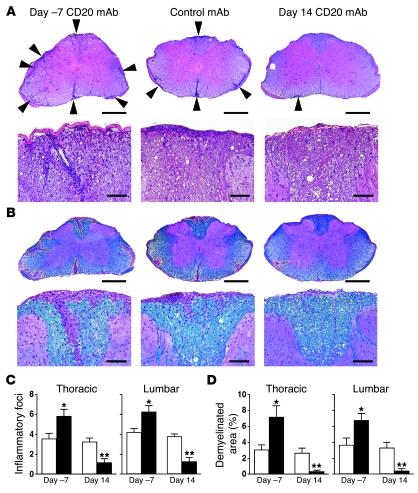
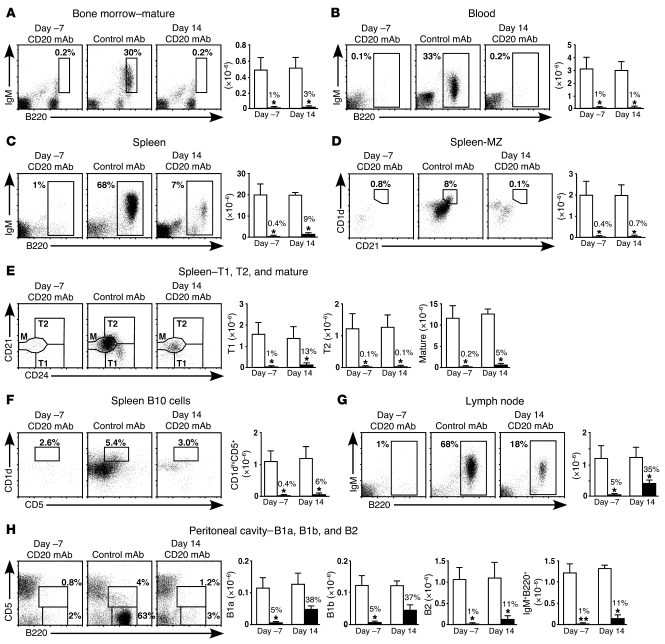
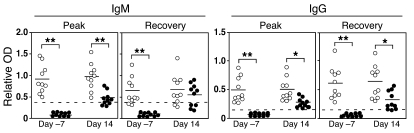
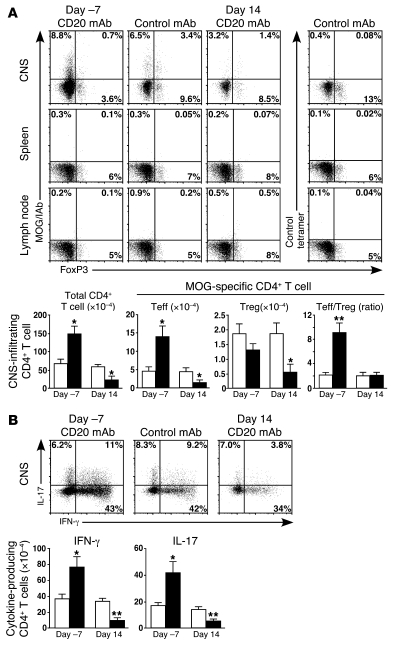
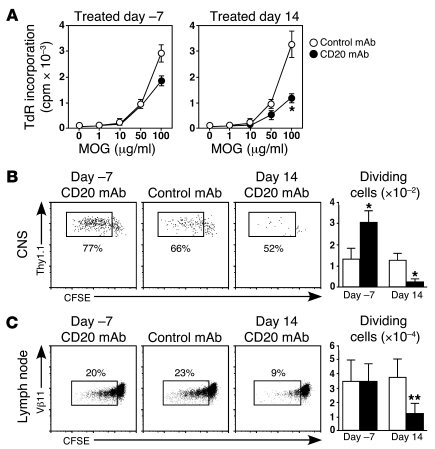
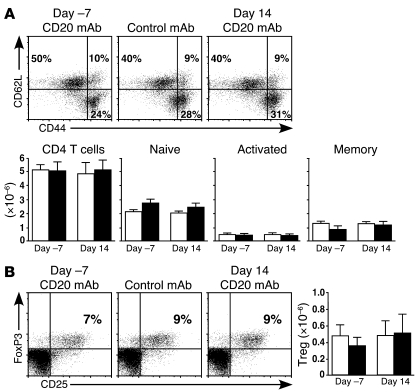
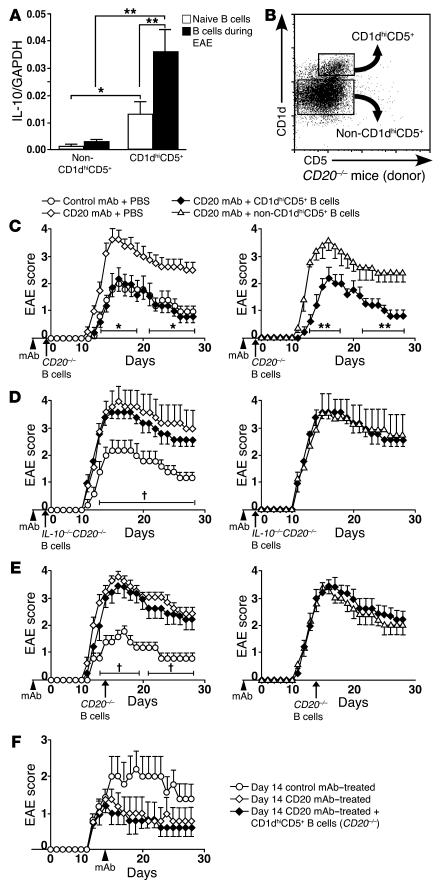
EAE is a mouse T cell-mediated autoimmune disease of the CNS used to model the human condition MS. The contributions of B cells to EAE initiation and progression are unclear. In this study, we have shown that EAE disease initiation and progression are differentially influenced by the depletion of B cells from mice with otherwise intact immune systems. CD20 antibody-mediated B cell depletion before EAE induction substantially exacerbated disease symptoms and increased encephalitogenic T cell influx into the CNS. Increased symptom severity resulted from the depletion of a rare IL-10-producing CD1dhiCD5+ regulatory B cell subset (B10 cells), since the adoptive transfer of splenic B10 cells before EAE induction normalized EAE in B cell-depleted mice. While transfer of regulatory B10 cells was maximally effective during early EAE initiation, they had no obvious role during disease progression. Rather, B cell depletion during EAE disease progression dramatically suppressed symptoms. Specifically, B cells were required for the generation of CD4+ T cells specific for CNS autoantigen and the entry of encephalitogenic T cells into the CNS during disease progression. These results demonstrate reciprocal regulatory roles for B cells during EAE immunopathogenesis. The therapeutic effect of B cell depletion for the treatment of autoimmunity may therefore depend on the relative contributions and the timing of these opposing B cell activities during the course of disease initiation and pathogenesis.


Figures

Figure 1
Figure 1. B cells regulate EAE severity.
B6 mice were treated with CD20 or control mAb (250 μg) before or after MOG immunization (days –7, 7, 14, or 21) and scored daily for EAE disease severity. Arrowheads indicate the day of mAb injection. Values represent (mean ± SEM) EAE clinical scores from more than 5 mice in each group, with similar results obtained in 3 independent experiments. Significant differences between CD20 and control mAb–treated groups are indicated; *P < 0.05.
Figure 2
Figure 2. Quantitative EAE histopathology following B cell depletion as in Figure 1.
(A and B) Representative lumbar spinal cord sections harvested 18 days after MOG immunizations (n ≥ 4 mice per group) show (A) inflammation (H&E staining) and (B) demyelination (Luxol Fast Blue staining). Upper panels are low magnification (scale bar: 0.5 mm). Lower panels are high magnification (scale bar: 0.01 mm). (A) Arrowheads indicate inflammatory foci. (B) Yellow traced areas indicate demyelination. (C) Bar graphs indicate (mean ± SEM) numbers of inflammatory foci and (D) demyelinated area, with significant differences between CD20 (black bars) and control mAb–treatments (white bars) indicated; *P < 0.05, **P < 0.005. Similar results were obtained in at least 2 independent experiments.
Figure 3
Figure 3. CD20 mAb–induced B cell depletion in EAE mice.
B6 mice were treated with CD20 or control mAb 7 days before or 14 days after MOG immunization. Representative depletion of B cells from the (A) bone marrow, (B) blood, (CF) spleen, (G) peripheral lymph nodes, and (H) peritoneal cavity 18 days after MOG immunization (n ≥ 4 mice per group) as determined by immunofluorescence staining with flow cytometry analysis. Within in the histograms, numbers indicate relative percentages of lymphocytes within the indicated gates. Bar graphs indicate (mean ± SEM) numbers of blood (per ml) and tissue B cells following mAb treatment. Within the bar graphs, numbers indicate the percentage of B cells of each phenotype found in CD20 mAb–treated mice (black bars) relative to the numbers of B cells found in control mAb–treated littermates (white bars). Significant differences between CD20 versus control mAb–treated mice are indicated; *P < 0.05, **P < 0.01. Data are representative of at least 2 independent experiments. MZ, marginal zone.
Figure 4
Figure 4. B cell depletion attenuates MOG-specific antibody production.
B6 mice were treated with CD20 (closed circles) or control (open circles) mAb 7 days before or 14 days after MOG immunization. Sera were collected 18 days (peak phase) and 28 days (recovery phase) after MOG immunization, with IgM and IgG MOG-specific antibody levels quantified by ELISA. Horizontal bars indicate mean values. Dashed lines indicate mean MOG-specific antibody values for unimmunized mice (n = 6). Significant differences between CD20 and control mAb–treated groups are indicated; *P < 0.01, **P < 0.001. Similar results were obtained in 2 independent experiments.
Figure 5
Figure 5. B cells regulate CNS-infiltrating CD4+ T cell numbers and activation during EAE development.
B6 mice were treated with mAb 7 days before or 14 days after MOG immunizations. CNS-infiltrating mononuclear cells were isolated from CNS tissue pooled from more than 3 mice per experiment, while splenocytes and lymph node lymphocytes were isolated from individual mice. (A) Representative histograms showing MOG-specific T cells following CD20 or control mAb treatments as determined by immunofluorescence staining with flow cytometry analysis. CD4+ T cells were staining with MOG/IAb or control tetramers 18 days after MOG immunizations and assessed by immunofluorescence staining with flow cytometry analysis. Representative MOG-specific Teff (MOG/IAb-tetramer+CD4+FoxP3) and Treg (MOG/IAb-tetramer+CD4+FoxP3+) frequencies are shown within the indicated CD4+ T cell quadrants. Numbers indicate percentages of CD4+ T cells within each quadrant. Bar graphs indicate numbers (mean ± SEM, n ≥ 4 experiments) of CNS-infiltrating CD4+ T cells and Teff and Tregs, and the ratio of Teff/Tregs following CD20 (black bars) or control mAb (white bars) treatments. (B) IL-17 and IFN-γ production by CNS-infiltrating CD4+ T cells 18 days after MOG immunization as determined by intracellular cytokine staining with flow cytometry analysis. Numbers indicate percentages of CD4+ T cells within the indicated quadrants. Bar graphs indicate numbers (mean ± SEM, n ≥ 3 experiments) of CNS-infiltrating IL-17+ and IFN-γ+ CD4+ T cells following CD20 (black bars) or control mAb (white bars) treatment. (A and B) Significant differences between sample means are indicated; *P < 0.05, **P < 0.01. Similar results were obtained in at least 2 independent experiments.
Figure 6
Figure 6. B cells regulate MOG-specific CD4+ T cell expansion.
B6 mice were treated with CD20 or control mAb 7 days before or 14 days after MOG immunizations. (A) Eighteen days after MOG immunizations, CD4+ T cells were purified from superficial lymph nodes and incubated with MOG peptide plus mitomycin C–treated B cells from control mAb–treated EAE mice (n ≥ 3 mice per group). Values indicate (mean ± SEM) [3H]-thymidine (TdR) uptake from triplicate cultures. (B) Seventeen days after MOG immunizations, CFSE-labeled TCRMOG CD4+Thy1.1+ T cells were transferred into Thy1.2 congenic recipients. Four days later, CNS-infiltrating cells were stained for CD4/Thy1.1 expression and analyzed for CFSE dilution by flow cytometry analysis. Representative frequencies of dividing CFSE-labeled cells are shown (gated on CD4+Thy1.1+ cells). (C) Seventeen days after MOG immunizations, CFSE-labeled TCRMOG CD4+ T cells were transferred into mice. Four days later, superficial lymph node cells were stained for Vβ11/CD4 expression and analyzed for CFSE dilution by flow cytometry. Representative frequencies of dividing CFSE-labeled cells are shown (gated on CD4+Vβ11+CFSE+ cells). (B and C) Bar graphs indicate (mean ± SEM) numbers of dividing TCRMOG T cells following CD20 (black bars) or control mAb (white bars) treatments. Numbers indicate percentages of CFSE-labeled CD4+ T cells. (AC) Significant differences between CD20 versus control mAb treatment are indicated; *P < 0.05, **P < 0.001. Similar results were obtained in at least 2 independent experiments.
Figure 7
Figure 7. B cell depletion does not affect splenic CD4+ or Treg numbers during EAE development.
Representative flow cytometry analysis of CD4+ T cell subsets 18 days after MOG immunizations (n ≥ 4 mice per group): (A) naive, CD4+CD44CD62L+; activated, CD4+CD44+CD62L+; memory CD4+CD44+CD62L; (B) and Treg, CD4+CD25+FoxP3+. Numbers show relative percentages of lymphocytes within each quadrant. Bar graphs indicate T cell numbers (mean ± SEM) following CD20 (black bars) or control (white bars) mAb treatments. Similar results were obtained in at least 2 independent experiments.
Figure 8
Figure 8. Regulatory CD1dhiCD5+ B10 cells suppress disease symptoms in EAE.
(A) Splenic CD1dhiCD5+ or non-CD1dhiCD5+ B cells were purified from naive mice or mice with EAE (day 10) by cell sorting. RNA was isolated from purified splenic B cells. Values represent relative mean IL-10 transcripts normalized to GAPDH transcript levels (mean ± SEM, n ≥ 6 mice per group) as quantified by real-time PCR analysis. Significant differences between sample means are indicated; *P < 0.05, **P < 0.01. Similar results were obtained in at least 2 independent experiments. (B) Representative results showing splenic CD19+ B cells from Cd20–/– mice sorted into regulatory CD1dhiCD5+ and nonregulatory CD1dhiCD5+ B cell subsets. (CE) Wild-type recipient mice that had been treated with CD20 or control mAb 7 days before MOG immunization (arrowheads) were given either purified CD1dhiCD5+ or non-CD1dhiCD5+ B cells from (C) naive Cd20–/– mice 2 days before immunization, (D) naive Il10–/–Cd20–/– mice 2 days before immunization, or (E) naive Cd20–/– mice 14 days after immunization. (F) Wild-type recipient mice treated with CD20 or control mAb 14 days after MOG immunization (arrowhead) were also given purified CD1dhiCD5+ B cells from naive Cd20–/– mice. Values represent (mean ± SEM) from more than 5 mice in each group, with similar results obtained in 2 independent experiments. Significant differences between the means of EAE clinical scores are indicated: *P < 0.05 (CD20 mAb treated plus CD1dhiCD5 versus mAb treated); **P < 0.05 (CD20 mAb treated plus CD1dhiCD5 versus CD20 mAb treated plus non–CD1dhiCD5+ treated); P < 0.05 (CD20 mAb treated plus CD1dhiCD5 versus control mAb treated).

Comment in

References

    1. Williams K.C., Ulvestad E., Hickey W.F. Immunology of multiple sclerosis. Clin. Neurosci. 1994;2:229–245. doi: 10.1016/S0967-5868(95)80007-7. - DOI - PubMed
    1. Pettinelli C.B., McFarlin D.E. Adoptive transfer of experimental allergic encephalomyelitis in SJL/J mice after in vitro activation of lymph node cells by myelin basic protein: requirement for Lyt 1+ 2– T lymphocytes. . J. Immunol. 1981;127:1420–1423. - PubMed
    1. Kuchroo V.K., et al. Cytokines and adhesion molecules contribute to the ability of myelin proteolipid protein-specific T cell clones to mediate experimental allergic encephalomyelitis. J. Immunol. 1993;151:4371–4382. - PubMed
    1. Park H., et al. A distinct lineage of CD4 T cells regulates tissue inflammation by producing interleukin 17. Nat. Immunol. 2005;6:1133–1141. doi: 10.1038/ni1261. - DOI - PMC - PubMed
    1. Kennedy M.K., Torrance D.S., Picha K.S., Mohler K.M. Analysis of cytokine mRNA expression in the central nervous system of mice with experimental autoimmune encephalomyelitis reveals that IL-10 mRNA expression correlates with recovery. J. Immunol. 1992;149:2496–2505. - PubMed

Publication types

MeSH terms