Flexible heteroarotinoid (Flex-Het) SHetA2 inhibits angiogenesis in vitro and in vivo
- PMID: 18802666
- PMCID: PMC2701494
- DOI: 10.1007/s10637-008-9175-7
Flexible heteroarotinoid (Flex-Het) SHetA2 inhibits angiogenesis in vitro and in vivo
Abstract
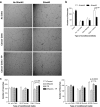
Flexible heteroarotinoids (Flex-Hets) compounds regulate growth, differentiation and apoptosis in cancer cells. The hypothesis of this study was that the lead Flex-Het, SHetA2, inhibits angiogenesis by blocking cytokine release from cancer cells. SHetA2 altered secretion of thrombospondin-4 (TSP-4), vascular endothelial growth factor A (VEGF) and fibroblast growth factor (bFGF) proteins from normal and cancerous ovarian and renal cultures. Thymidine phosphorylase (TP) expression was inhibited in cancer, but not normal cultures. Endothelial tube formation was stimulated by conditioned media from cancer but not normal cultures, and SHetA2 reduced secretion of this angiogenic activity. SHetA2 directly inhibited endothelial cell tube formation and proliferation through G1 cell cycle arrest, but not apoptosis. Recombinant TP reversed SHetA2 anti-angiogenic activity. SHetA2 inhibition of in vivo angiogenesis was observed in Caki-1 renal cancer xenografts. In conclusion, SHetA2 inhibits angiogenesis through alteration of angiogenic factor secretion by cancer cells and through direct effects on endothelial cells.
Figures


Similar articles
-
Development of flexible-heteroarotinoids for kidney cancer.Mol Cancer Ther. 2009 May;8(5):1227-38. doi: 10.1158/1535-7163.MCT-08-1069. Epub 2009 May 5. Mol Cancer Ther. 2009. PMID: 19417155 Free PMC article.
-
Flexible heteroarotinoids (Flex-Hets) exhibit improved therapeutic ratios as anti-cancer agents over retinoic acid receptor agonists.Invest New Drugs. 2005 Oct;23(5):417-28. doi: 10.1007/s10637-005-2901-5. Invest New Drugs. 2005. PMID: 16133793
-
CAAT/enhancer binding protein homologous protein-dependent death receptor 5 induction is a major component of SHetA2-induced apoptosis in lung cancer cells.Cancer Res. 2008 Jul 1;68(13):5335-44. doi: 10.1158/0008-5472.CAN-07-6209. Cancer Res. 2008. PMID: 18593935
-
Synthesis and evaluation of second generation Flex-Het scaffolds against the human ovarian cancer A2780 cell line.Eur J Med Chem. 2015;96:209-17. doi: 10.1016/j.ejmech.2015.03.070. Epub 2015 Apr 4. Eur J Med Chem. 2015. PMID: 25880346
-
Synthesis and biological evaluation of SHetA2 (NSC-721689) analogs against the ovarian cancer cell line A2780.Eur J Med Chem. 2019 May 15;170:16-27. doi: 10.1016/j.ejmech.2019.03.010. Epub 2019 Mar 7. Eur J Med Chem. 2019. PMID: 30878829
Cited by
-
Vaginal Suppositories Containing SHetA2 to Treat Cervical Dysplasia: Pharmacokinetics of Daily Doses and Preliminary Safety Profile.J Pharm Sci. 2020 Jun;109(6):2000-2008. doi: 10.1016/j.xphs.2020.02.016. Epub 2020 Feb 27. J Pharm Sci. 2020. PMID: 32113976 Free PMC article.
-
Induction of death receptor ligand-mediated apoptosis in epithelial ovarian carcinoma: The search for sensitizing agents.Gynecol Oncol. 2009 Dec;115(3):438-42. doi: 10.1016/j.ygyno.2009.09.007. Epub 2009 Oct 4. Gynecol Oncol. 2009. PMID: 19804900 Free PMC article.
-
Complementary Targeting of Rb Phosphorylation and Growth in Cervical Cancer Cell Cultures and a Xenograft Mouse Model by SHetA2 and Palbociclib.Cancers (Basel). 2020 May 17;12(5):1269. doi: 10.3390/cancers12051269. Cancers (Basel). 2020. PMID: 32429557 Free PMC article.
-
NF-kappaB is involved in SHetA2 circumvention of TNF-alpha resistance, but not induction of intrinsic apoptosis.Anticancer Drugs. 2010 Mar;21(3):297-305. doi: 10.1097/CAD.0b013e3283350e43. Anticancer Drugs. 2010. PMID: 20032777 Free PMC article.
-
Pharmacokinetics and Pharmacodynamics of Escalating Doses of SHetA2 After Vaginal Administration to Mice.J Pharm Sci. 2018 Dec;107(12):3179-3186. doi: 10.1016/j.xphs.2018.08.024. Epub 2018 Sep 6. J Pharm Sci. 2018. PMID: 30196041 Free PMC article.
References
-
- {'text': '', 'ref_index': 1, 'ids': [{'type': 'PubMed', 'value': '10768596', 'is_inner': True, 'url': 'https://pubmed.ncbi.nlm.nih.gov/10768596/'}]}
- Amato RJ (2000) Chemotherapy for renal cell carcinoma. Semin Oncol 27:177–186 - PubMed
-
- {'text': '', 'ref_index': 1, 'ids': [{'type': 'DOI', 'value': '10.1097/CCO.0b013e32827035f0', 'is_inner': False, 'url': 'https://doi.org/10.1097/cco.0b013e32827035f0'}, {'type': 'PubMed', 'value': '17762578', 'is_inner': True, 'url': 'https://pubmed.ncbi.nlm.nih.gov/17762578/'}]}
- Rosa DD, Clamp AR, Collinson F, Jayson GC (2007) Antiangiogenic therapy for ovarian cancer. Curr Opin Oncol 19:497–505 doi:10.1097/CCO.0b013e32827035f0 - PubMed
-
- {'text': '', 'ref_index': 1, 'ids': [{'type': 'DOI', 'value': '10.1097/01.cco.0000219260.60714.c4', 'is_inner': False, 'url': 'https://doi.org/10.1097/01.cco.0000219260.60714.c4'}, {'type': 'PubMed', 'value': '16552243', 'is_inner': True, 'url': 'https://pubmed.ncbi.nlm.nih.gov/16552243/'}]}
- Rini BI, Campbell SC, Rathmell WK (2006) Renal cell carcinoma. Curr Opin Oncol 18:289–296 doi:10.1097/01.cco.0000219260.60714.c4 - PubMed
-
- {'text': '', 'ref_index': 1, 'ids': [{'type': 'DOI', 'value': '10.1056/NEJMra0706596', 'is_inner': False, 'url': 'https://doi.org/10.1056/nejmra0706596'}, {'type': 'PMC', 'value': 'PMC4542009', 'is_inner': False, 'url': 'https://pmc.ncbi.nlm.nih.gov/articles/PMC4542009/'}, {'type': 'PubMed', 'value': '18463380', 'is_inner': True, 'url': 'https://pubmed.ncbi.nlm.nih.gov/18463380/'}]}
- Kerbel RS (2008) Tumor angiogenesis. N Engl J Med 358:2039–2049 doi:10.1056/NEJMra0706596 - PMC - PubMed
-
- {'text': '', 'ref_index': 1, 'ids': [{'type': 'DOI', 'value': '10.1002/ijc.10907', 'is_inner': False, 'url': 'https://doi.org/10.1002/ijc.10907'}, {'type': 'PubMed', 'value': '12532428', 'is_inner': True, 'url': 'https://pubmed.ncbi.nlm.nih.gov/12532428/'}]}
- Grant DS, Williams TL, Zahaczewsky M, Dicker AP (2003) Comparison of antiangiogenic activities using paclitaxel (taxol) and docetaxel (taxotere). Int J Cancer 104:121–129 doi:10.1002/ijc.10907 - PubMed
Publication types
MeSH terms
Substances
Grants and funding
LinkOut - more resources
Full Text Sources
Molecular Biology Databases
Miscellaneous

