. 2008 Oct;48(4):1273-81.
doi: 10.1002/hep.22461.

Calcium influx mechanisms underlying calcium oscillations in rat hepatocytes

Affiliations

Calcium influx mechanisms underlying calcium oscillations in rat hepatocytes

Bertina F Jones et al. Hepatology. 2008 Oct.

Abstract

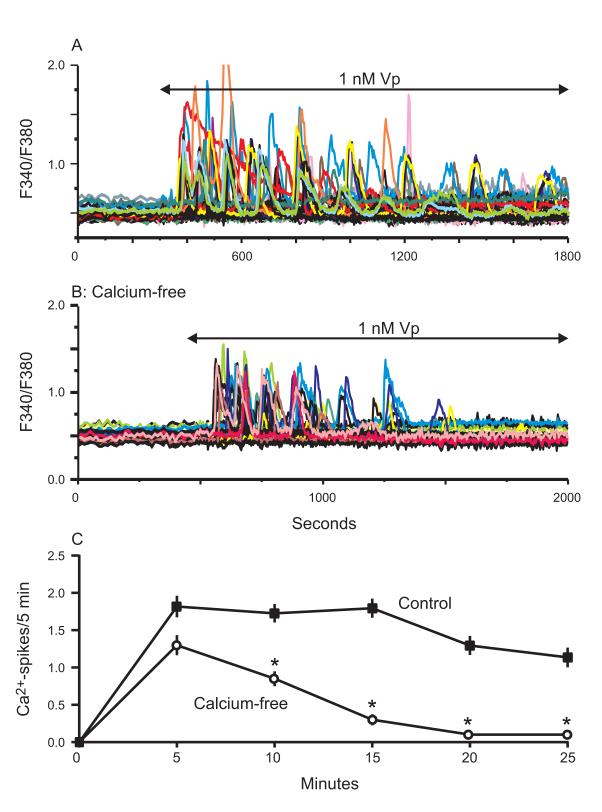
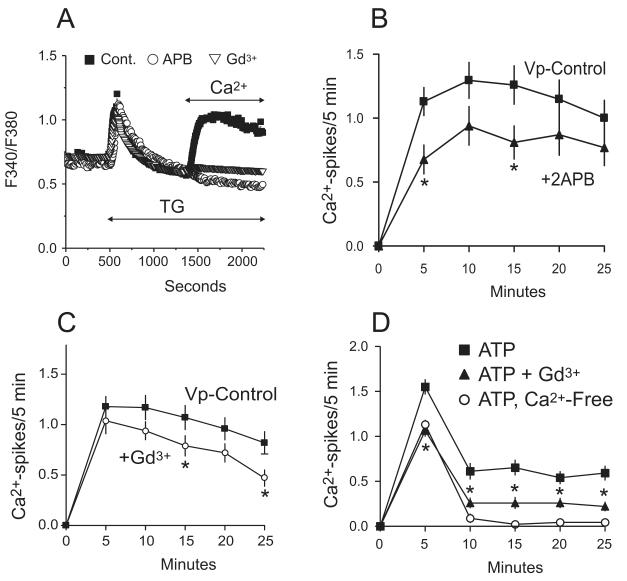
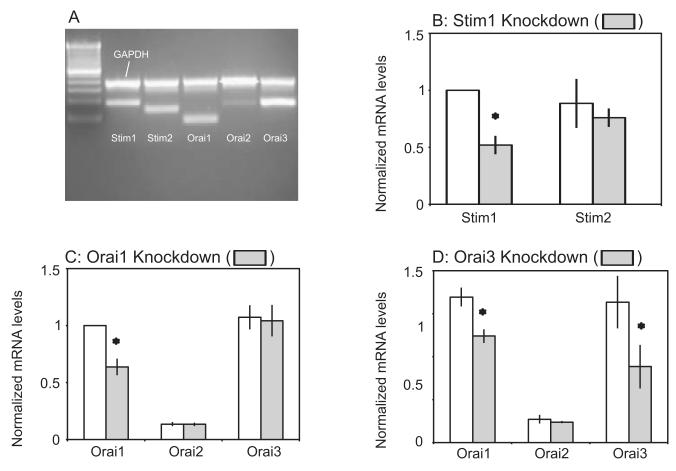
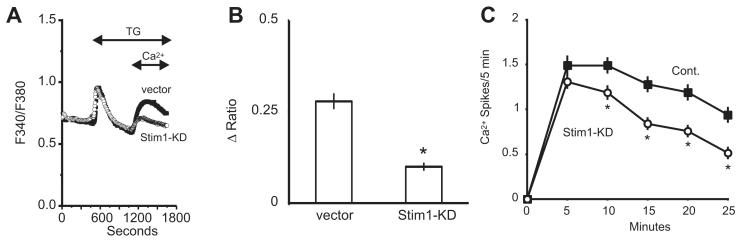
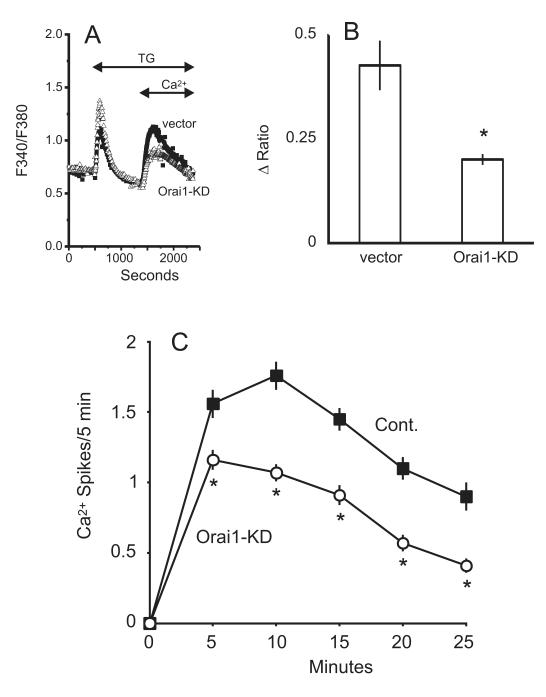
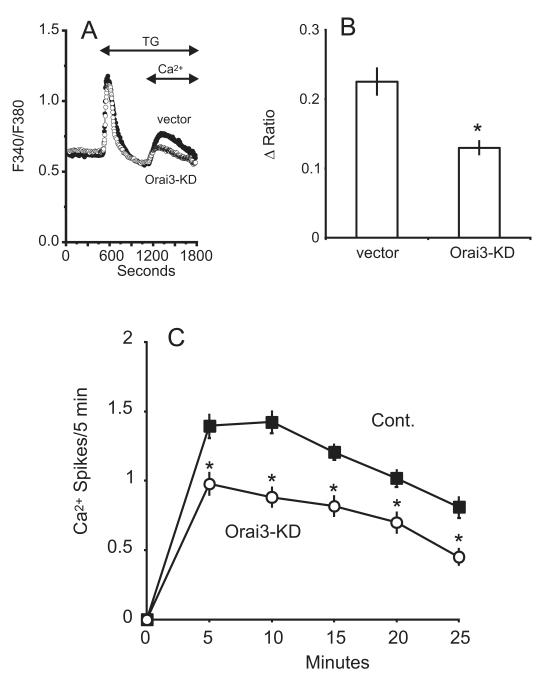
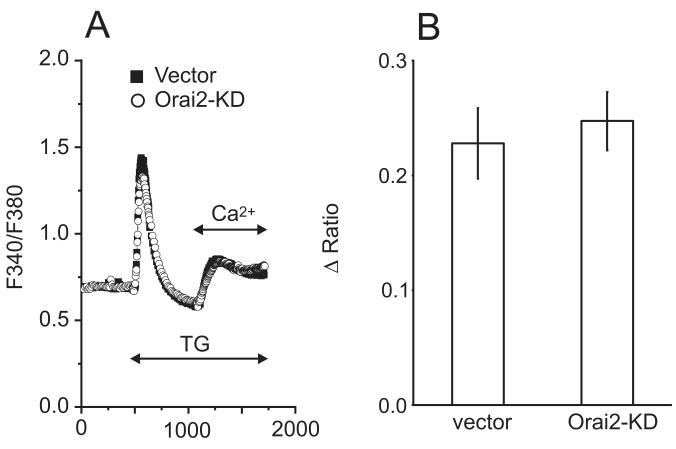
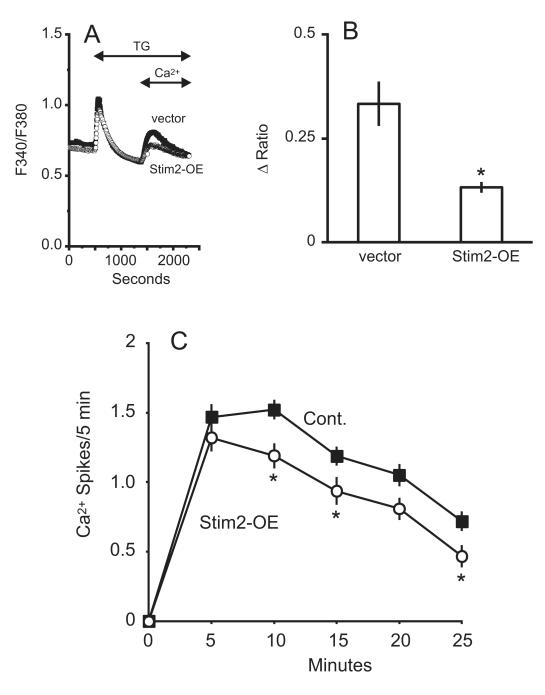
The process of capacitative or store-operated Ca(2+) entry has been extensively investigated, and recently two major molecular players in this process have been described. Stromal interacting molecule (STIM) 1 acts as a sensor for the level of Ca(2+) stored in the endoplasmic reticulum, and Orai proteins constitute pore-forming subunits of the store-operated channels. Store-operated Ca(2+) entry is readily demonstrated with protocols that provide extensive Ca(2+) store depletion; however, the role of store-operated entry with modest and more physiological cell stimuli is less certain. Recent studies have addressed this question in cell lines; however, the role of store-operated entry during physiological activation of primary cells has not been extensively investigated, and there is little or no information on the roles of STIM and Orai proteins in primary cells. Also, the nature of the Ca(2+) influx mechanism with hormone activation of hepatocytes is controversial. Hepatocytes respond to physiological levels of glycogenolytic hormones with well-characterized intracellular Ca(2+) oscillations. In the current study, we have used both pharmacological tools and RNA interference (RNAi)-based techniques to investigate the role of store-operated channels in the maintenance of hormone-induced Ca(2+) oscillations in rat hepatocytes. Pharmacological inhibitors of store-operated channels blocked thapsigargin-induced Ca(2+) entry but only partially reduced the frequency of Ca(2+) oscillations. Similarly, RNAi knockdown of STIM1 or Orai1 substantially reduced thapsigargin-induced calcium entry, and more modestly diminished the frequency of vasopressin-induced oscillations.

Conclusion: Our findings establish that store-operated Ca(2+) entry plays a role in the maintenance of agonist-induced oscillations in primary rat hepatocytes but indicate that other agonist-induced entry mechanisms must be involved to a significant extent.


Figures

Figure 1
Figure 1. Calcium oscillations run down in the absence of extracellular Ca2+
A) Vasopressin induced calcium oscillations in hepatocytes loaded with fura-5F. An ensemble of 30-35 individual cells displayed a range of frequencies in response to 1 nM vasopressin, with a few cells exhibiting sustained signals. B) Vasopressin-induced oscillations are significantly diminished in Ca2+-free media, where N=30 cells. C) For each condition described above, the oscillation frequency is summarized as the number of Ca2+ spikes per 5 minute interval following agonist-stimulation. The data is taken from 3 independent experiments and is reported as the mean ± SEM, where N=53 and 54 cells for the 1.8 mM and nominally- free Ca2+ conditions, respectively. Student’s t-test revealed a significant change in the number of Ca2+ spikes/5 min for each time point, denoted by “*” (p < 0.05).
Figure 2
Figure 2. Effect of SOCE inhibitors on thapsigargin (TG) induced entry and agonist-induced Ca2+ oscillations
A) Shown is a trace of 30-35 hepatocytes, representative of 3 experiments, under control conditions (filled squares) or pre-treated with either 30 μM 2APB (open circles) or 1 μM Gd3+ (open triangles) before adding thapsigargin in the absence of Ca2+ followed by addition of 1.8 mM Ca2+. Treatment with 2APB or Gd3+ completely blocks the Ca2+ entry. B-C) The frequency of vasopressin-induced oscillations is diminished by 2APB or Gd3+. The data is taken from 3 independent experiments and is reported as the mean ± SEM, where N=54 and 50 cells for 2APB or Gd3+, respectively. One-Way ANOVA revealed which time points had a significant change in the number of Ca2+ spikes, denoted by “*” (p < 0.05). D) ATP-induced oscillations in Ca2+ free media or 1 μM Gd3+ follow trends similar to that observed when using vasopressin. The data, taken from 3 independent experiments, is reported as the mean ± SEM where N=98, 82, and 60 for 5 μM ATP, 1 μM Gd3+, or nominally-free Ca2+, respectively. One-Way Anova revealed a significant change in the number of Ca2+ spikes for each time point, denoted by “*” (p < 0.0001).
Figure 3
Figure 3. Presence of messenger RNA for STIM and Orai homologues in primary hepatocytes and real-time PCR verification of message knockdown by shRNA
A) RT-PCR reveals mRNA message for STIM1, STIM2, Orai1, Orai2, and Orai3. Using GAPDH as a housekeeping gene, STIM1 and STIM2 were expressed in relatively equal amounts as well as Orai1 and Orai3. In comparison, the message for Orai2 was low but detectable in hepatocytes. B) STIM1 shRNA-transfected cells significantly reduced the STIM1, but not the STIM2 message as revealed using One-Way ANOVA, denoted by “*” (p < 0.05). C) The mRNA message in Orai1-knockdown cells was significantly reduced, but did not affect Orai2 or Orai3 message levels as revealed using One-Way ANOVA, denoted by “*” (p < 0.05). D) Orai3 shRNA significantly reduced both the Orai3 and Orai1 message as revealed using One-Way ANOVA, denoted by “*” (p < 0.05). Real-time PCR measurements were made from RNA extracted from 2 independent transfection experiments, each in triplicate.
Figure 4
Figure 4. Effect of STIM1-shRNA knockdown on thapsigargin (TG) induced calcium entry and vasopressin-induced Ca2+ oscillations
A) Thapsigargin-induced calcium entry was compared in hepatocytes transfected with the empty vector (filled symbols) or shRNA against STIM1 (open symbols). The traces are averages of 25 -30 cells from a single experiment, representative of 5 experiments. B) For the vector and STIM1 shRNA-transfected cells, summarized data are shown for the change in the peak Ca2+ entry amplitude. Student’s t-test revealed a significant decrease in the thapsigargin-induced entry in STIM1 knockdown cells, denoted by “*” (p < 0.05). C) The average frequency of vasopressin-induced calcium oscillations is shown for STIM1 shRNA-transfected vs. control-transfected cells, where N=107 and 100 cells, respectively. Student’s t-test revealed a significant change in the number of Ca2+ spikes for each time point after the initial 5-minute period, denoted by “*” (p < 0.05).
Figure 5
Figure 5. Effect of Orai1-shRNA knockdown on thapsigargin (TG) induced calcium entry and vasopressin-induced Ca2+ oscillations
A) Thapsigargin-induced calcium entry was compared in hepatocytes transfected with the prs vector (filled symbols) or shRNA against Orai1 (open symbols). The traces are averages of 25 -30 cells from a single experiment, representative of 5 experiments. B) For control and Orai1 shRNA- transfected cells, summarized data are shown for the change in the peak Ca2+ entry amplitude. Student’s t-test revealed a significant decrease in the thapsigargin-induced entry in Orai1 knockdown cells, denoted by “*” (p < 0.05). C) The average oscillation frequency is shown for Orai1 shRNA-transfected vs. control-transfected cells, where N=123 and 107 cells, respectively. Student’s t-test revealed a significant change in the number of Ca2+ spikes for each time point following agonist-addition, denoted by “*” (p < 0.05).
Figure 6
Figure 6. Effect of Orai3-shRNA knockdown on thapsigargin (TG) induced calcium entry and vasopressin-induced Ca2+ oscillations
A) Thapsigargin-induced calcium entry was compared in hepatocytes transfected with the prs vector (filled symbols) or shRNA against Orai3 (open symbols). The traces are averages of 25 -30 cells from a single experiment, representative of 5 experiments. B) For control and Orai3 shRNA- transfected cells, summarized data are shown for the change in the peak Ca2+ entry amplitude. Student’s t-test revealed a significant decrease in the thapsigargin-induced entry in Orai3 knockdown cells, denoted by “*” (p < 0.05). C) The average oscillation frequency is shown for the Orai3 shRNA-transfected condition vs. control-transfected, where N=93 and 111 cells, respectively. Student’s t-test revealed a significant change in the number of Ca2+ spikes for each time point following agonist-addition, denoted by “*” (p < 0.05).
Figure 7
Figure 7. Effect of Orai2-shRNA knockdown on thapsigargin (TG) induced calcium entry
A) Thapsigargin-induced calcium entry was compared in hepatocytes transfected with the prs vector (filled symbols) or shRNA against Orai2 (open symbols). The traces are averages of 25 -30 cells from a single experiment, representative of 3 experiments. B) For control and Orai2 shRNA- transfected cells, summarized data are shown for the change in the peak Ca2+ entry amplitude.
Figure 8
Figure 8. Effect of STIM2 Overexpression on thapsigargin (TG) induced calcium entry and vasopressin-induced Ca2+ oscillations
A) Transfection with STIM2 cDNA (open symbols) attenuates the thapsigargin-stimulated calcium entry compared to vector transfected cells (filled symbols). The traces are averages of 25-30 cells from a single experiment, representative of 3 experiments. B) For control and STIM2-transfected cells, summarized data are shown for the change in the peak Ca2+ entry amplitude. Student’s t-test revealed a significant decrease in the thapsigargin-induced entry in STIM2-transfected cells, denoted by “*” (p < 0.05). C) The average frequency of oscillations is shown for STIM2-transfected and vector cells, where N=50 and 96 cells, respectively. Student’s t-test revealed a significant change in the number of Ca2+ spikes for the 10, 15, and 25 minute time points, denoted by “*” (p < 0.05).

Similar articles

Cited by

References

    1. Woods NM, Cuthbertson KS, Cobbold PH. Repetitive transient rises in cytoplasmic free calcium in hormone-stimulated hepatocytes. Nature. 1986;319:600–602. - PubMed
    1. Rooney TA, Sass EJ, Thomas AP. Characterization of cytosolic calcium oscillations induced by phenylephrine and vasopressin in single fura-2-loaded hepatocytes. J Biol Chem. 1989;264:17131–17141. - PubMed
    1. Robb-Gaspers LD, Thomas AP. Coordination of Ca2+ signaling by intercellular propagation of Ca2+ waves in the intact liver. J Biol Chem. 1995;270:8102–8107. - PubMed
    1. Tordjmann T, Berthon B, Claret M, Combettes L. Coordinated intercellular calcium waves induced by noradrenaline in rat hepatocytes: dual control by gap junction permeability and agonist. EMBO J. 1997;16:5389–5407. - PMC - PubMed
    1. Putney JW. A model for receptor-regulated calcium entry. Cell Calcium. 1986;7:1–12. - PubMed

Publication types

MeSH terms