. 2008 Sep 19:4:21.
doi: 10.1186/1746-4811-4-21.

Visualizing the actin cytoskeleton in living plant cells using a photo-convertible mEos::FABD-mTn fluorescent fusion protein

Affiliations

Visualizing the actin cytoskeleton in living plant cells using a photo-convertible mEos::FABD-mTn fluorescent fusion protein

Mike Schenkel et al. Plant Methods. .

Abstract

Background: The actin cytoskeleton responds quickly to diverse stimuli and plays numerous roles in cellular signalling, organelle motility and subcellular compartmentation during plant growth and development. Molecular and cell biological tools that can facilitate visualization of actin organization and dynamics in a minimally invasive manner are essential for understanding this fundamental component of the living cell.

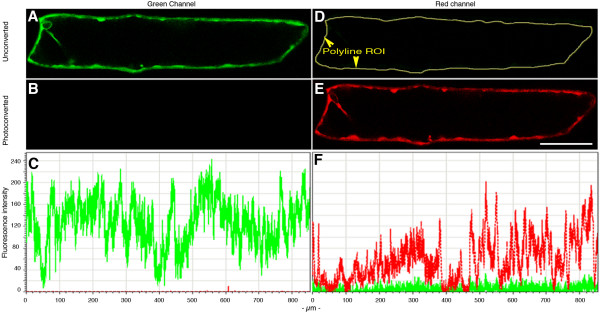
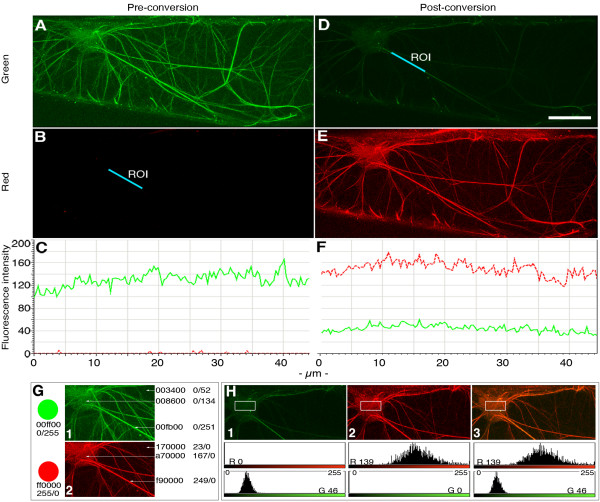
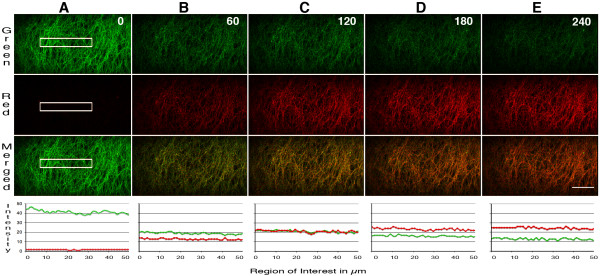
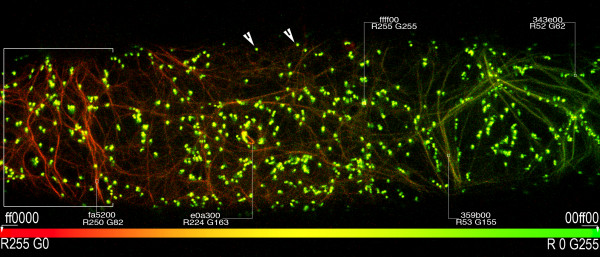
Results: A novel, monomeric (m) Eos-fluorescent protein derived from the coral Lobophyllia hemprichii was assessed for its green to red photo-convertibility in plant cells by creating mEosFP-cytosolic. mEosFP was fused to the F-(filamentous)-Actin Binding Domain of the mammalian Talin gene to create mEosFP::FABDmTalin. Photo-conversion, visualization and colour quantification protocols were developed for EosFP targeted to the F-actin cytoskeleton. Rapid photo-conversion in the entire cell or in a region of interest was easily achieved upon illumination with an approximately 400 nm wavelength light beam using an epi-fluorescent microscope. Dual color imaging after photo-conversion was carried out using a confocal laser-scanning microscope. Time-lapse imaging revealed that although photo-conversion of single mEosFP molecules can be rapid in terms of live-cell imaging it involves a progressive enrichment of red fluorescent molecules over green species. The fluorescence of photo-converted cells thus progresses through intermediate shades ranging from green to red. The time taken for complete conversion to red fluorescence depends on protein expression level within a cell and the quality of the focusing lens used to deliver the illuminating beam. Three easily applicable methods for obtaining information on fluorescent intensity and colour are provided as a means of ensuring experimental repeatability and data quantification, when using mEosFP and similar photo-convertible proteins.

Conclusion: The mEosFP::FABD-mTn probe retains all the imaging qualities associated with the well tested GFP::mTn probe while allowing for non-invasive, regional photo-conversion that allows colour based discrimination within a living cell. Whereas a number of precautions should be exercised in dealing with photo-convertible probes, mEosFP::FABD-mTn is a versatile live imaging tool for dissecting the organization and activity of the actin cytoskeleton in plants.


Figures

Figure 1
Figure 1
Photo-conversion of mEosFP-cytosolic following its transient expression in an onion epidermal cell. A.B.C. Unconverted mEosFP-Cyto visualized in green channel (500 to 525 nm) 'A'; and red channel (585 to 680 nm) 'B'. C depicts the fluorescence intensity graph observed in images A and B using the poly-line ROI (arrowheads) traced out in panel D. D.E.F. mEosFP-cyto fluorescence in green 'D' and red 'E' channels observed approximately 10 seconds after photo-conversion. F depicts the combined fluorescence intensity for D and E. Images were acquired within 10 seconds of photo-conversion. Note the shift in fluorescence intensities of red and green fluorescence between pre- and post-conversion states.
Figure 2
Figure 2
Expression and photo-conversion of mEosFP::FABD-mTn following its transient expression in an onion epidermal cell. Photo-conversion was carried out using a D-excitation filter (UV/Violet; Ex: BP355–425/Dich: 455/LP 470) on a Leica DM600B epi-fluorescent microscope. Pre- and post-conversion images were acquired using 488 and 543 nm laser lines. Images were acquired within 10 seconds after photo-conversion. A.B.C. Pre-conversion fluorescence status 'A' in the green fluorescence acquisition channel; 'B' in the red channel; C depicts the fluorescence intensity along a straight line ROI (panel B, D) for both channels. Note the very low level of fluorescence picked up by the Leica fluorescence quantification tool for the red channel as compared to the green channel. D.E.F. Post conversion fluorescence status for green ' D' and red 'E' channels. Color profile shows a complete inversion in the relationship between green and red fluorescence emissions along the selected ROI. Images D and E were captured within 10 seconds of photo-conversion. The fluorescence intensity scale is based on a 0–255 RGB colour code. Bar = 50 μm. G. An Adobe Photoshop-based approach to draw out information on colour quality and the relative red/green values in an internationally accepted colour code. Absolute green is 00ff00 or 0/255 while absolute red is ff0000 or 255/0. The 'eye-dropper' tool in Photoshop provides direct readouts of R/G values. Arrows point to examples of some readouts from cropped regions of A and E. H. An imageJ-based approach for creating colour histograms from an image. The red and green components in the rectangular ROI in panels 1–3 are depicted on a scale of 0–255 for each colour. Panel 1 and the histogram below it depict greenness within the image (cropped portion of panel D); Panel 2 (cropped portion of panel E) depicts redness in the same region after photo-conversion whereas panel 3 is a merge of panel 1 and 2 and accurately reflects the merged mean values obtained for them.
Figure 3
Figure 3
Time lapse images on the xy axes of a region of an onion epidermal cell expressing mEosFP::FABD-mTn taken before photo-conversion and after 60 seconds exposition through a D-filter (UV/Violet; Ex: BP355–425/Dichr: 455/LP 470) using a 0.5 NA 20× lens, demonstrate the progressive enrichment of red fluorescent species over green protein molecules. Accompanying traces for the ROI depicted in panel A confirm the changes observed visually. Whereas a significant jump in red fluorescence can be seen in Panel B already the amount of green fluorescent molecules is still higher, nearly equal fluorescence values appear in panel C and a significant increase is seen in red fluorescence in panels D and E. Size Bar = 25 μm.
Figure 4
Figure 4
Localized photo-activation of mEosFP::FABD-mTn along with a YFP-SKL marker targeted to peroxisomes demonstrates the feasibility of using the F-actin marker in simultaneous multicolour live-imaging schemes. The left portion of the cell was photo-converted and exhibits a visible change in coloration. The ICC-compliant standard representation of colour coding has been followed. The colour bar thus extends between absolute red (R255 G0/ff0000) to absolute green (R0 G255/00ff00) and demonstrate the spread of colours in the image. Small regions of interest sampled using the eye-dropper tool in Adobe Photoshop provided direct read-outs of colour values from the image. Note that peroxisomes (arrowheads) highlighted using YFP-SKL maintain a median (R255 G255/ffff00) value.

References

    1. Prasher DC, Eckenrode VK, Ward WW, Prendergast FG, Cormier MJ. Primary structure of the Aequorea victoria green-fluorescent protein. Gene. 1992;111:229–233. doi: 10.1016/0378-1119(92)90691-H. - DOI - PubMed
    1. Chalfie M, Tu Y, Euskirchen G, Ward WW, Prasher DC. Green fluorescent protein as a marker for gene expression. Science. 1994;263:802–805. doi: 10.1126/science.8303295. - DOI - PubMed
    1. Köhler RH. GFP for in vivo imaging of subcellular structures in plant cells. Trends in Plant Science. 1998;3:317–320. doi: 10.1016/S1360-1385(98)01276-X. - DOI
    1. Hanson MR, Kohler RH. GFP imaging: Methodology and application to investigate cellular compartmentation in plants. J Exp Bot. 2001;52:529–539. doi: 10.1093/jexbot/52.356.529. - DOI - PubMed
    1. Giepmans BNG, Adams SR, Ellisman MH, Tsien RY. The fluorescent toolbox for assessing protein location and function. Science. 2006;312:217–224. doi: 10.1126/science.1124618. - DOI - PubMed

LinkOut - more resources