. 2008 Sep 21:1:42.
doi: 10.1186/1755-8794-1-42.

The removal of multiplicative, systematic bias allows integration of breast cancer gene expression datasets - improving meta-analysis and prediction of prognosis

Affiliations

The removal of multiplicative, systematic bias allows integration of breast cancer gene expression datasets - improving meta-analysis and prediction of prognosis

Andrew H Sims et al. BMC Med Genomics. .

Abstract

Background: The number of gene expression studies in the public domain is rapidly increasing, representing a highly valuable resource. However, dataset-specific bias precludes meta-analysis at the raw transcript level, even when the RNA is from comparable sources and has been processed on the same microarray platform using similar protocols. Here, we demonstrate, using Affymetrix data, that much of this bias can be removed, allowing multiple datasets to be legitimately combined for meaningful meta-analyses.

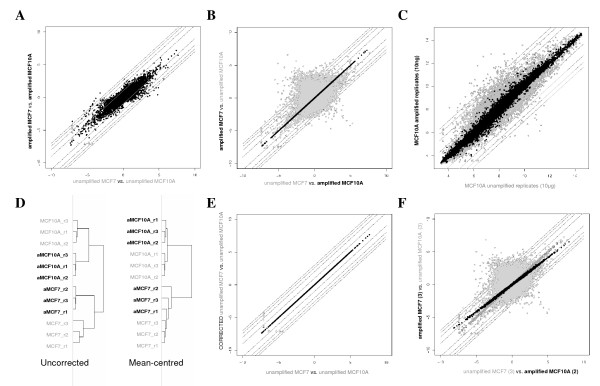
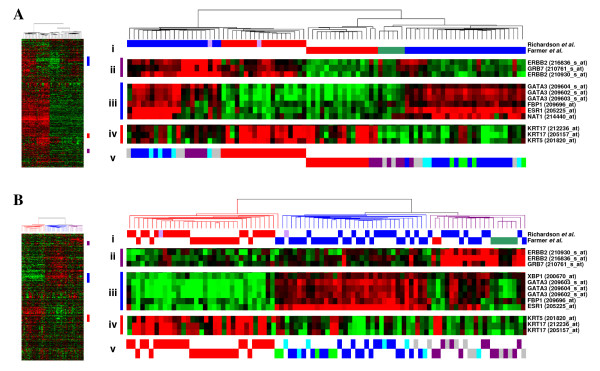
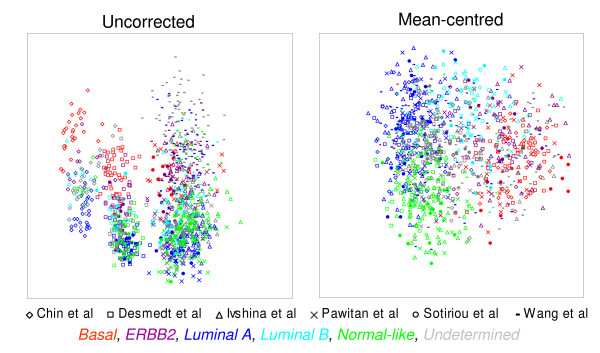
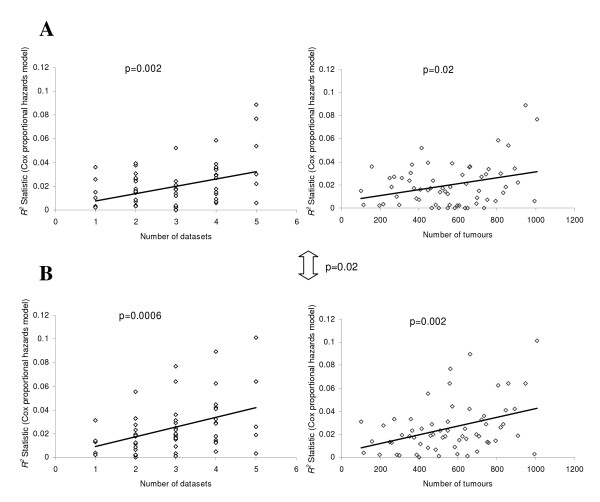
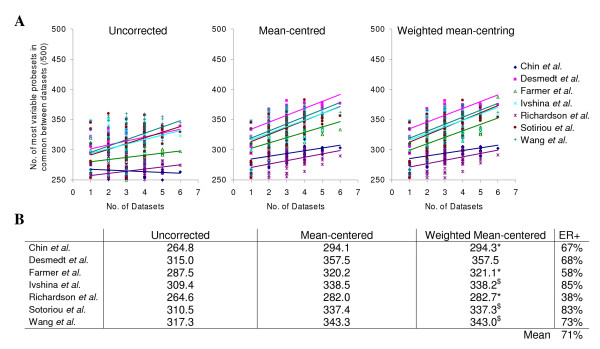
Results: A series of validation datasets comparing breast cancer and normal breast cell lines (MCF7 and MCF10A) were generated to examine the variability between datasets generated using different amounts of starting RNA, alternative protocols, different generations of Affymetrix GeneChip or scanning hardware. We demonstrate that systematic, multiplicative biases are introduced at the RNA, hybridization and image-capture stages of a microarray experiment. Simple batch mean-centering was found to significantly reduce the level of inter-experimental variation, allowing raw transcript levels to be compared across datasets with confidence. By accounting for dataset-specific bias, we were able to assemble the largest gene expression dataset of primary breast tumours to-date (1107), from six previously published studies. Using this meta-dataset, we demonstrate that combining greater numbers of datasets or tumours leads to a greater overlap in differentially expressed genes and more accurate prognostic predictions. However, this is highly dependent upon the composition of the datasets and patient characteristics.

Conclusion: Multiplicative, systematic biases are introduced at many stages of microarray experiments. When these are reconciled, raw data can be directly integrated from different gene expression datasets leading to new biological findings with increased statistical power.


Figures

Figure 1
Figure 1
Comparison of Affymetrix gene expression data generated using amplified and unamplified protocols. A, Comparing fold changes between unamplified and amplified datasets demonstrates reasonable correlation. B, Comparing fold changes across datasets (unamplified MCF7 with amplified MCF10A and vice versa) is clearly impractical (grey spots), however following mean batch-centering there is excellent correlation across the datasets (black spots). C, Comparison of mean raw expression levels for amplified and unamplified MCF10A replicates before (grey) and after mean batch-centering (black). D, Pearson clustering of the GeneChips representing the same cell lines is tighter following mean-centering. E, Mean-centering has no effect on fold changes between datasets. F, Mean-centering of unbalanced datasets (duplicate rather than triplicate amplified MCF10A) results in a distortion of the comparison (black spots), however this is rectified with weighted mean-centering (open dark grey spots), both methods show a dramatic improvement over uncorrected data (light grey spots).
Figure 2
Figure 2
Comparison of breast tumour gene expression profiles generated by two published studies. The Farmer et al. study used U133A GeneChips with RNA amplification, whereas the Richardson et al. study used U133 plus 2.0 arrays and the standard labeling protocol. A, Before mean batch-centering. B, After mean batch-centering. Hierarchical clustering of tumours based upon 640 probesets representing Sorlie et al. [8] 'intrinsic' genes. Thumbnails show all 640 probesets. i) Tumours classified by Richardson et al. [10] red = basal-like, blue = non-basal like, pink = BRCA1; tumours classified by Farmer et al. [11] red = basal, blue = luminal, green = apocrine. Clusters of genes associated with the 'Sorlie subtypes' are highlighted as follows; ii) ERBB2 gene cluster, iii) luminal A gene cluster, iv) basal gene cluster. v) Centroid prediction was used to assign the tumours to the five Norway/Stanford subtypes – basal (red), luminal A (dark blue), luminal B (light blue), ERBB2 (purple) and normal-like (green), unassigned (grey).
Figure 3
Figure 3
Dataset-specific bias in published Affymetrix breast cancer studies. Multidimensional scaling for all common probesets (22,215) for 1107 breast tumours from six published studies [16-21] on U133A, U133AA and U133 plus 2.0 GeneChips. Tumours from different datasets are distinguished by symbol. Tumours assigned to one of the five Sorlie et al. subtypes by centroid prediction are discriminated by colours. With uncorrected data the tumours cluster by study, following mean-centering the tumours cluster by molecular subtype.
Figure 4
Figure 4
Combining datasets or tumours and mean-centering significantly increases prognostic prediction. A, Before mean batch-centering. B, After mean batch-centering. The R2 statistic (Cox proportional hazards model) is an assessment of the performance of the predictor generated using each combination of training datasets and the remaining test datasets, generated using supervised principal components analysis. Median values are used where a training dataset was used to assess more than one test dataset (up to 5). R2 and p-value results for all possible combinations of training datasets and test datasets (1016) are given in the matrix in Additional File 6.
Figure 5
Figure 5
Combining greater numbers of datasets leads to a greater overlap in differentially expressed probesets. Lists of the five hundred probesets with the highest variance were generated for each dataset and combinations of up to six datasets and the number of probesets in common between these lists were plotted for each dataset. A, Plots show the number of common probesets between each individual dataset and other single or combined datasets. B, Overall mean numbers of genes in common for each dataset.

References

    1. Brazma A, Kapushesky M, Parkinson H, Sarkans U, Shojatalab M. Data storage and analysis in ArrayExpress. Methods Enzymol. 2006;411:370–386. doi: 10.1016/S0076-6879(06)11020-4. - DOI - PubMed
    1. Chu TM, Deng S, Wolfinger R, Paules RS, Hamadeh HK. Cross-site comparison of gene expression data reveals high similarity. Environ Health Perspect. 2004;112:449–455. - PMC - PubMed
    1. Barrett T, Suzek TO, Troup DB, Wilhite SE, Ngau WC, Ledoux P, Rudnev D, Lash AE, Fujibuchi W, Edgar R. NCBI GEO: mining millions of expression profiles – database and tools. Nucleic Acids Res. 2005:D562–566. - PMC - PubMed
    1. Pepper SD, Saunders EK, Edwards LE, Wilson CL, Miller CJ. The utility of MAS5 expression summary and detection call algorithms. BMC Bioinformatics. 2007;8:273. doi: 10.1186/1471-2105-8-273. - DOI - PMC - PubMed
    1. Dai M, Wang P, Boyd AD, Kostov G, Athey B, Jones EG, Bunney WE, Myers RM, Speed TP, Akil H, et al. Evolving gene/transcript definitions significantly alter the interpretation of GeneChip data. Nucleic Acids Res. 2005;33:e175. doi: 10.1093/nar/gni179. - DOI - PMC - PubMed

LinkOut - more resources