. 2008 Dec 15;480(2):132-7.
doi: 10.1016/j.abb.2008.09.001. Epub 2008 Sep 10.

Spectroscopic and kinetic studies of Nor1, a cytochrome P450 nitric oxide reductase from the fungal pathogen Histoplasma capsulatum

Affiliations

Spectroscopic and kinetic studies of Nor1, a cytochrome P450 nitric oxide reductase from the fungal pathogen Histoplasma capsulatum

Lily Y Chao et al. Arch Biochem Biophys. .

Abstract

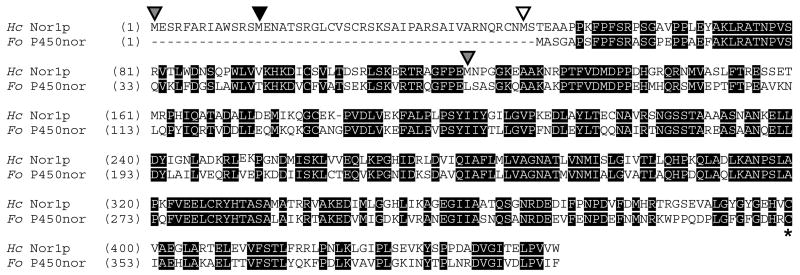
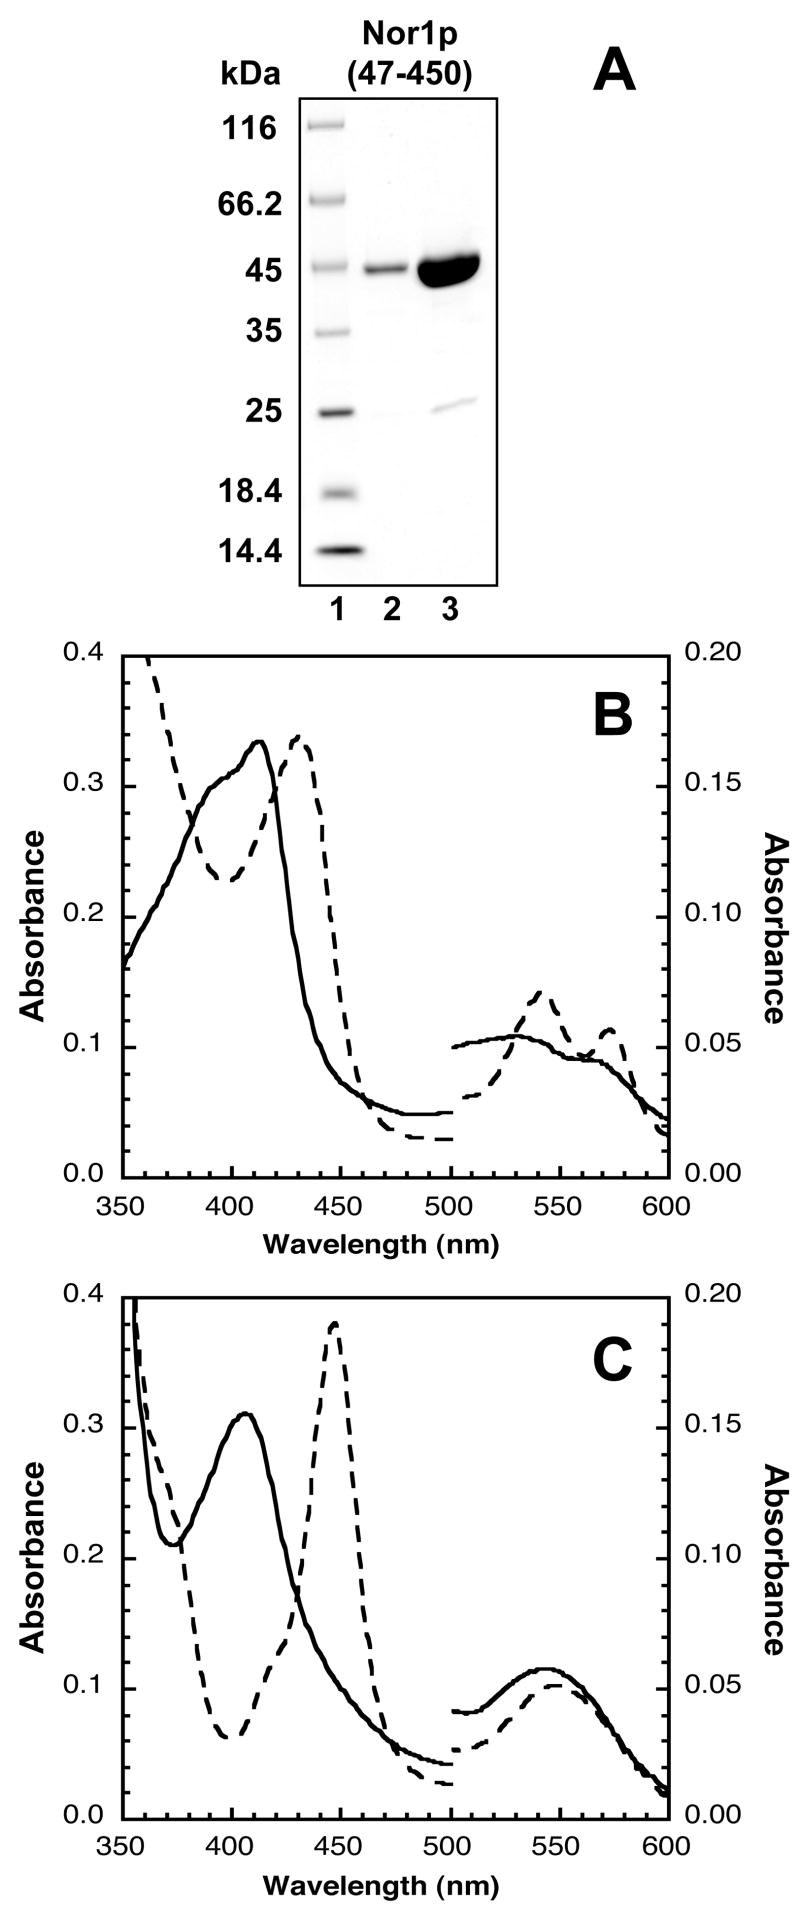
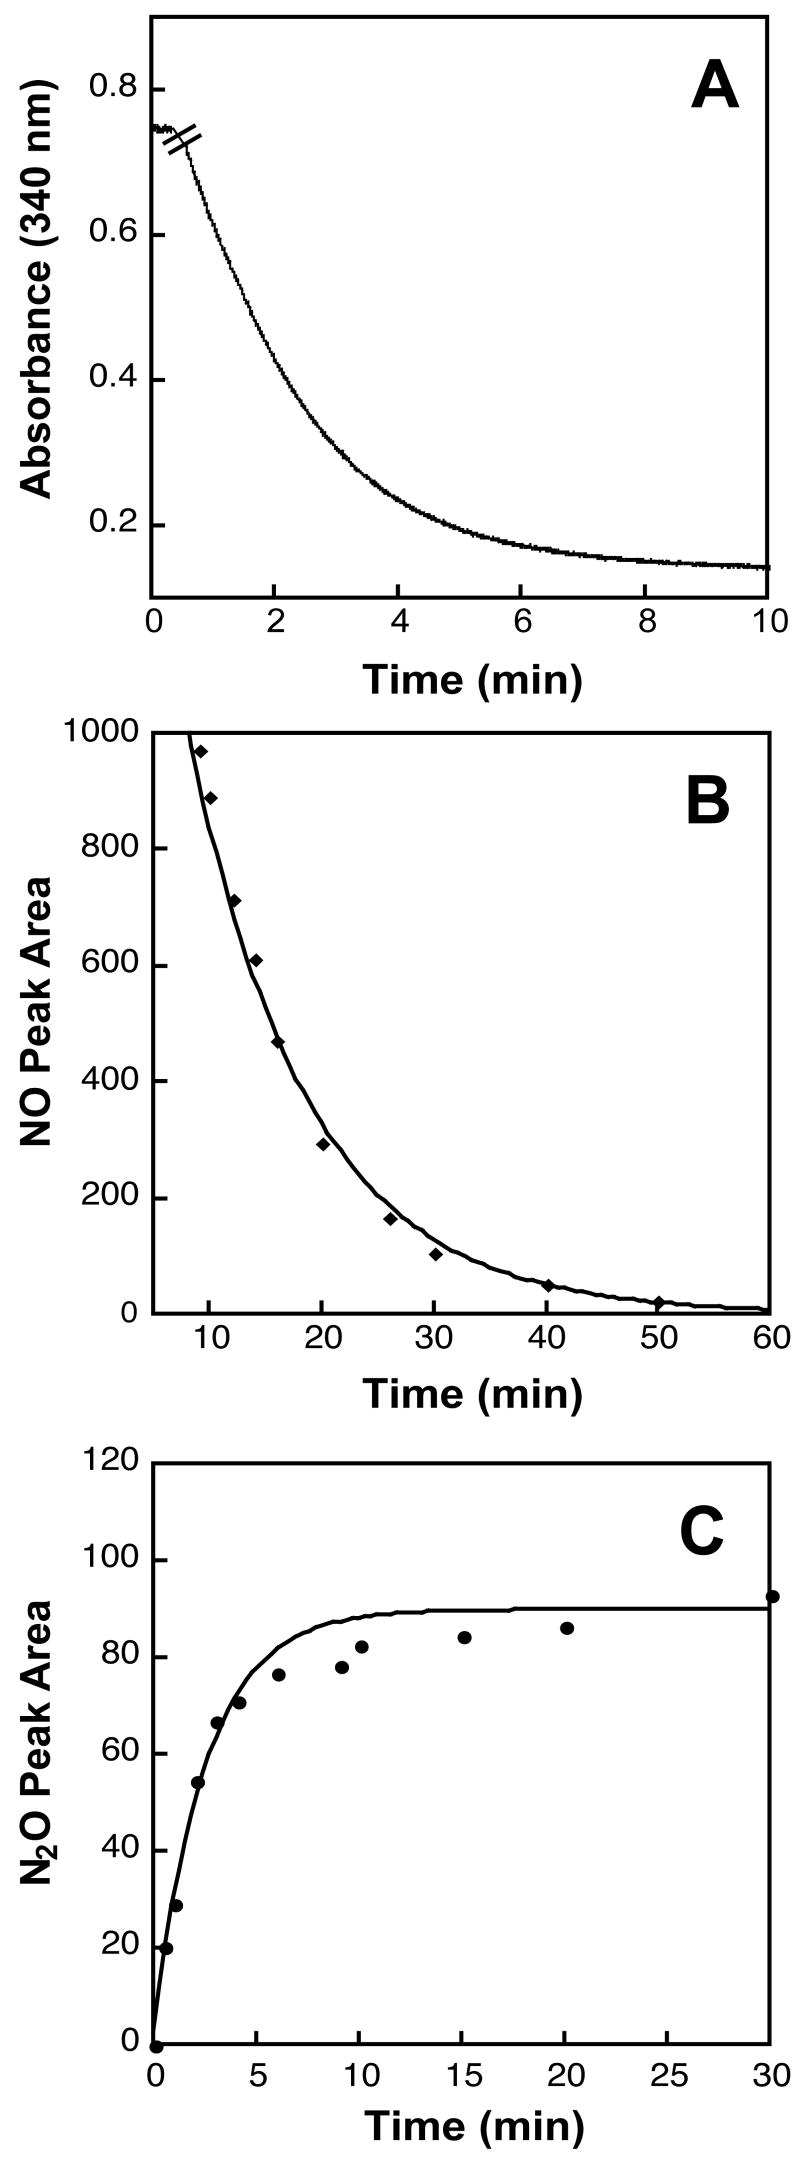
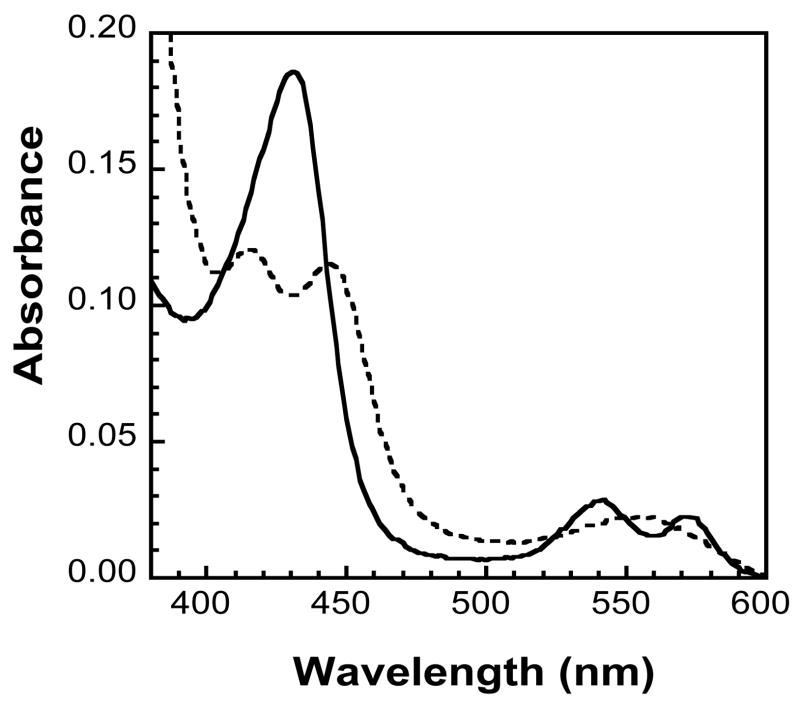
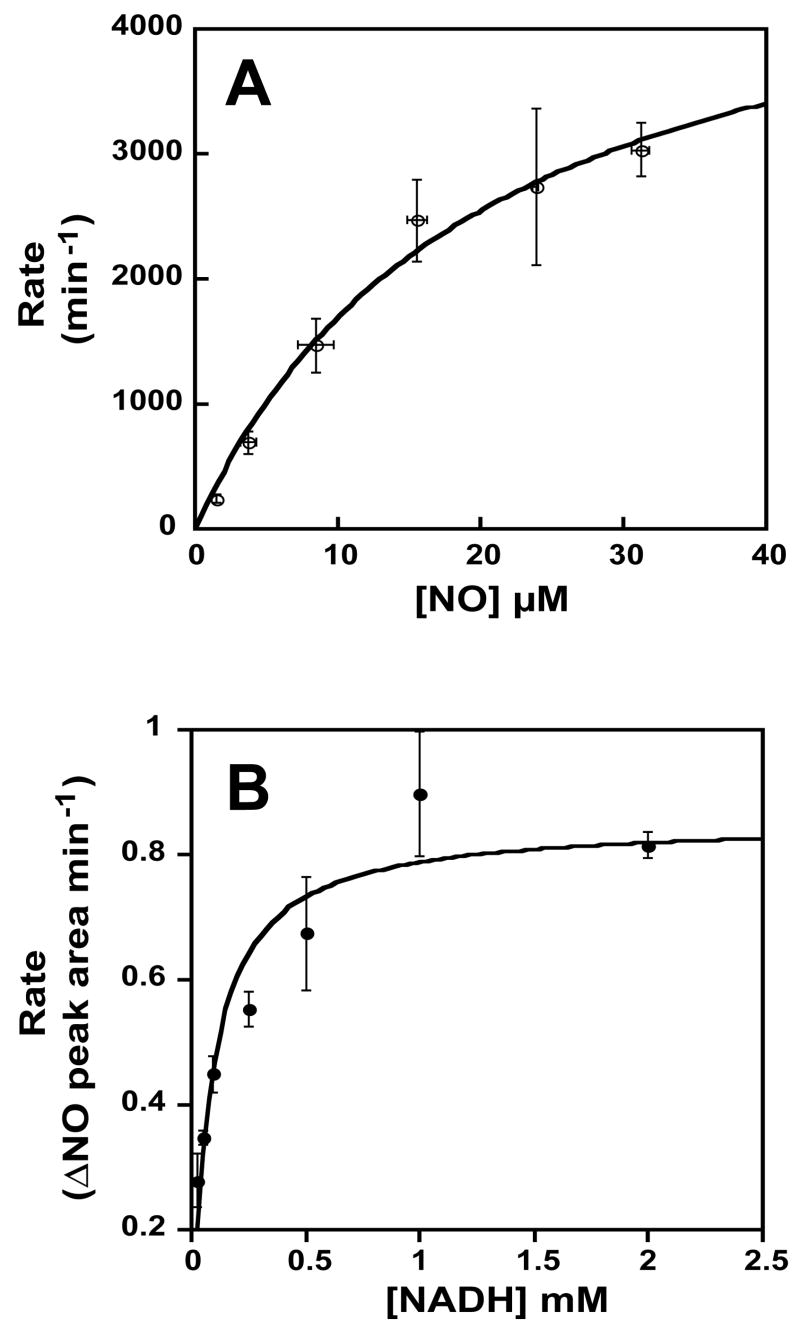
The fungal respiratory pathogen Histoplasma capsulatum evades the innate immune response and colonizes macrophages during infection. Although macrophage production of the antimicrobial effector nitric oxide (NO) restricts H. capsulatum growth, the pathogen is able to establish a persistent infection. H. capsulatum contains a P450 nitric oxide reductase homologue (NOR1) that may be important for detoxifying NO during infection. To characterize the activity of this putative P450 enzyme, a 404 amino acid fragment of Nor1p was expressed in Escherichia coli and purified to homogeneity. Spectral characterization of Nor1p indicated that it was similar to other fungal P450 nitric oxide reductases. Nor1p catalyzed the reduction of NO to N2O using NADH as the direct reductant. The K(M) for NO was determined to be 20 microM and the k(cat) to be 5000 min(-1). Together, these results provide evidence for a protective role of a P450 nitric oxide reductase against macrophage-derived NO.


Figures

Figure 1
Figure 1
Alignment between predicted H. capsulatum Nor1p (Hc Nor1p) and F. oxysporum P450nor (Fo P450nor). Identical residues are shaded in black. Gray arrowheads mark the start of the two predicted Nor1 proteins. The start of the Nor1(47-450) protein that was characterized in this study is marked with a white arrowhead. Another potential start that was not examined here is marked with a black arrowhead. The cysteine that ligates the heme is marked with a star. The alignment was generated using AlignX from Vector NTI®(Invitrogen).
Figure 2
Figure 2
Electronic absorption spectra of Nor1p(47-450) in various oxidation/ligation states. (A) SDS-PAGE gel analysis of Nor1p(47-450). Protein samples were mixed with SDS loading dye with reductant, boiled and run on a 10–20% Tris-glycine gel. Lane 1, Unstained Protein Molecular Weight Marker (Fermentas); Lane 2, Nor1p (~2 μg); Lane 3, Nor1p (~10 μg). (B) Solid line, ligand-free Fe3+-Nor1p; dashed line, NO-bound Fe3+-Nor1p. (C) Solid line, dithionite-reduced Fe2+-Nor1p; dashed line, CO-bound Fe2+-Nor1p.
Figure 3
Figure 3
Activities of purified Nor1p(48-450). (A) Time course of the absorbance change of NADH (~0.13 mM) at 340 nm in the presence of saturated NO. The hatch mark indicates the time when enzyme (~130 nM) was added to the sample. There was no oxidation observed with NADPH. (B) Time course change of NO peak area measured by NOA. DEA-NONOate (1mM) was allowed to react in 100 mM phosphate buffer, pH 7.5, 5 mM NADH for 30 min at 37°C. The reaction sample (2 mL in a 5 mL gas-tight vial) was then cooled to 25°C before enzyme (~130 nM) was added. Headspace (15 μL) was sampled every few minutes. In the absence of enzyme, there was no significant change in the NO concentration (data not shown). (C) Time course change of N2O peak area measured by GC-ECD. DEA-NONOate (500 μM) was allowed to react with 2 mL NADH/phosphate buffer in a 15 mL gas-tight vial before enzyme (~40 nM) was added to initiate the reaction. Headspace (5 μL) was sampled every few minutes. Each time point represents duplicate samples and the error bars represent ranges.
Figure 4
Figure 4
Electronic absorption spectra of NO-bound Fe3+-Nor1p (solid line) and its intermediate NADH reduced product (dotted line) observed at −10°C. The NO and NADH concentrations were both ~100 μM and the amount of Nor1p protein was ~2 μM.
Figure 5
Figure 5
Kinetics of NO consumption by Nor1p. (A) Activity in the presence of increasing concentrations of NO. The data were fit to a Michaelis-Menten equation to yield the estimated KM and maximum turnover number for NO. (B) Activity in the presence of increasing concentrations of NADH. The data were fit to a Michaelis-Menten equation to yield the estimated KM for NADH.

Similar articles

Cited by

References

    1. Marletta MA. J Biol Chem. 1993;268:12231–12234. - PubMed
    1. Moncada S, Palmer RM, Higgs EA. Pharmacol Rev. 1991;43:109–142. - PubMed
    1. Wienberg JB. In: Nitric oxide and infection. Fang FC, editor. Kluwer Academic/Plenum Publishers; New York: 1999. pp. 95–150.
    1. Dedon PC, Tannenbaum SR. Arch Biochem Biophys. 2004;423:12–22. - PubMed
    1. DeGroote MA, Fang FC. In: Nitric oxide and infection. Fang FC, editor. Kluwer Academic/Plenum Publishers; New York: 1999. pp. 231–261.

Publication types

MeSH terms

LinkOut - more resources