. 2009:93:595-611.
doi: 10.1016/S0072-9752(08)93029-3.

Eye syndromes and the neuro-ophthalmology of stroke

Affiliations

Eye syndromes and the neuro-ophthalmology of stroke

Valérie Biousse et al. Handb Clin Neurol. 2009.
No abstract available


Figures

Figure 1
Figure 1. Blood supply to the eye and optic nerve
(A) Superior view of the right orbit showing the internal carotid artery, the ophthalmic artery and its branches in the orbit. (B) Lateral view of the optic nerve showing the arterial blood supply of the optic nerve via very small branches of the ophthalmic artery (posterior ciliary artery). Reprinted with permission from Biousse V, Newman NJ. Neuro-Ophthalmology Illustrated. Thieme, 2009.
Figure 2
Figure 2. Acute central retinal artery occlusion in the right eye
A) Funduscopic photographs showing an acute central retinal artery occlusion in the right eye (OD, shown on the left). Note the attenuated central retinal artery with segmental arterial narrowing in the right eye (arrow heads) compared with the left eye (OS, shown on the right). The ischemic retina is edematous and appears whitish compared to the left eye and there is a cherry red spot (*). B) Fluorescein angiography of the right eye (OD) at 37seconds after injection of fluorescein dye in an arm vein (shown on the left), and at more than 1 minute (shown on the right). There is delayed retinal arterial filling (arrow heads). Venous filling (arrows) is also delayed at more than 1minute.
Figure 3
Figure 3. Right optic atrophy secondary to an old central retinal artery occlusion
Funduscopic photograph showing an old central retinal artery occlusion in the right eye (OD, shown on the left). Note the optic disc pallor with narrowing and sheathing of some arterioles in the right eye (arrow heads) compared with the left eye (OS, shown on the right).
Figure 4
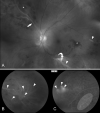
Figure 4. Examples of retinal artery emboli
Funduscopic photographs showing: (A) a refractile cholesterol retinal embolus (Hollenhorst plaque, arrow head) found in the right eye of a patient who had an episode of transient visual loss in the right eye (OD); (B) a branch retinal artery embolus in a patient with monocular vision loss in the left eye (OS). The embolus is whitish and disrupts the blood flow within the artery, suggesting a platelet-fibrin embolus (arrow head) from carotid artery atheroma. There is an intraretinal hemorrhage inferiorly related to retinal ischemia (*); (C) multiple bilateral retinal emboli (arrow heads) in the setting of valvular endocarditis (Roth’s spots) with bilateral branch arterial occlusions and two intraretinal hemorrhages OS (*).
Figure 5
Figure 5. Left ophthalmic artery occlusion
Funduscopic photograph showing a severe left ophthalmic artery occlusion with massive retinal ischemia and ischemic disc edema. The arteries are barely visible and there is no cherry red spot (arrow head).
Figure 6
Figure 6. Left venous stasis retinopathy
Funduscopic photograph showing venous stasis retinopathy in the left eye (OS, shown on the right) secondary to a left internal carotid artery occlusion. Note the multiple retinal hemorrhages (*), with microaneurysms (arrow heads).
Figure 7
Figure 7. Right Horner syndrome related to a right internal carotid artery occlusion
There is mild right upper lid ptosis and anisocoria with the right pupil being smaller than the left pupil in the light (A) and in the dark (B). The anisocoria is greater in the dark than in the light and there was dilation lag of the right pupil in the dark.
Figure 8
Figure 8. Left homonymous hemianopia secondary to a right occipital infarction
(A) 24-2 Humphrey visual fields showing a complete left homonymous hemianopia (the right eye visual field is on the right and the left eye visual field is on the left. (B) FLAIR axial brain MRI demonstrates a right occipital infarction in the territory of the right posterior cerebral artery.
Figure 9
Figure 9. Bilateral homonymous hemianopia related to posterior reversible encephalopathy syndrome
(A) 24-2 Humphrey visual fields showing a complete right homonymous hemianopia and an incomplete congruous left homonymous hemianopia. This patient had malignant hypertension and the FLAIR axial brain MRI (B) showed bilateral occipital lesions suggesting posterior reversible encephalopathy syndrome (PRES). The visual field defects resolved after treatment of the hypertension and the brain MRI normalized within two weeks.
Figure 10
Figure 10. Retinal vasculitis
(A) Funduscopic photograph of the left eye showing extensive vasculitis with periarterial sheathing (arrow heads), a branch retinal artery occlusion (arrow), and retinal ischemia; note the cotton-wool spots (curved arrow) and intraretinal hemorrhages (*). (B) Magnification of the same photograph showing the periarterial sheating (arrow heads). (C) Fluorescein angiogram (at 3 minutes and 8 seconds) showing arterial leakage (arrow heads) and the very attenuated arterial vasculature (white ellipse).
Figure 11
Figure 11. Funduscopic and fluorescein angiographic findings in Susac syndrome
(A) Funduscopic photograph of a young woman with recurrent bilateral branch retinal artery occlusions related to Susac syndrome. There is an area of ischemia superiorly (*) in the right eye (OD, shown on the left). In the left eye (OS, shown on the right) there is diffuse arterial attenuation and optic disc pallor from prior arterial occlusions. (B) Fluorescein angiogram of the right eye showing 3 areas of arterial leakage distant from the ischemic retina (arrow heads), highly suggestive of Susac syndrome.
Figure 12
Figure 12. Hypertensive retinopathy stage IV
Funduscopic photographs showing severe bilateral retinal changes with disc edema suggesting hypertensive retinopathy stage IV. Note the bilateral optic nerve head edema, cotton wool spots (arrow heads) and superficial retinal hemorrhages (*). Blood pressure was 200/130 mmHg.
Figure 13
Figure 13. Left Terson syndrome
Funduscopic photograph showing a preretinal hemorrhage inferior to the optic nerve (arrow head) in a patient with subarachnoid hemorrhage, consistent with Terson syndrome.
Figure 14
Figure 14. Indirect dural carotid cavernous fistula with bilateral sixth nerve palsies
(A) External photograph of a 55 year old woman with bilateral sixth nerve palsies with esotropia, and dilation of the episcleral vessels in both eyes. T2-axial brain MRI through the upper part of the orbits (B) and T1-coronal orbital MRI with contrast and fat suppression showing dilation of both superior ophthalmic veins (arrow heads). A catheter angiogram showed a complex indirect dural carotid cavernous fistula draining mostly posteriorly.
Figure 15
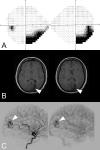
Figure 15. Right homonymous hemianopia related to a left occipital arteriovenous malformation
(A) 24-2 Humphrey visual fields showing an incomplete congruous right homonymous hemianopia. (B) Brain MRI showed a heterogeneous and irregular hyposignal in the left occipital lobe on the axial-T1-weighted image. (C) Catheter cerebral angiogram confirmed a left occipital arteriovenous malformation.
Figure 16
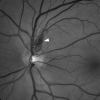
Figure 16. Retinal cavernous hemangioma
Funduscopic photograph showing a small retinal cavernous hemangioma superior to the optic nerve in the left eye.
Figure 17
Figure 17. Right central retinal vein occlusion
Funduscopic photograph showing a right central retinal vein occlusion with dilation and tortuosity of the veins, multiple retinal hemorrhages, and disc edema.
Figure 18
Figure 18. Branch retinal vein occlusion
Funduscopic photograph showing an inferior temporal branch retinal vein occlusion in the right eye. The vein is occluded by the artery at an arteriovenous crossing (arrow head). The area of superficial retinal hemorrhages is limited to the territory drained by the occluded vein.
Figure 19
Figure 19. Cerebral venous thrombosis
(A) Fundus photographs showing bilateral prominent papilledema from raised intracranial pressure. (B) Brain MRV (coronal shown on the left and axial shown on the right) showing occlusion of the right transverse sinus and right sigmoid sinus (arrow heads).

Similar articles

Cited by

References

    1. Fisher CM. ‘Transient monocular blindness’ versus ‘amaurosis fugax’. Neurology. 1989;39(12):1622–4. - PubMed
    1. Biousse V, Trobe JD. Transient monocular visual loss. Am J Ophthalmol. 2005;140(4):717–21. - PubMed
    1. Biousse V. Cerebrovascular diseases. In: Miller N, Newman N, Biousse B, Kerrison J, editors. Walsh & Hoyt’s Clinical Neuro-Ophthalmology. 6th edition Williams & Wilkins; Philadelphia: 2005. pp. 1967–2168.
    1. Luneau K, Newman NJ, Biousse V. Ischemic optic neuropathies. Neurologist. 2008;14(6):341–54. - PubMed
    1. Hayreh SS, Zimmerman MB. Fundus changes in central retinal artery occlusion. Retina. 2007;27(3):276–89. - PubMed