Review
. 2009 Jan;1788(1):47-52.
doi: 10.1016/j.bbamem.2008.08.014. Epub 2008 Sep 5.

Phase diagrams and lipid domains in multicomponent lipid bilayer mixtures

Affiliations
Review

Phase diagrams and lipid domains in multicomponent lipid bilayer mixtures

Gerald W Feigenson. Biochim Biophys Acta. 2009 Jan.

Abstract

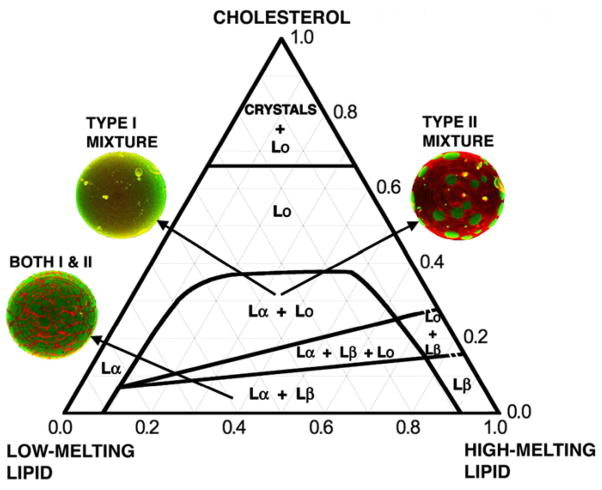
Understanding the phase behavior of biological membranes is helped by the study of more simple systems. Model membranes that have as few as 3 components exhibit complex phase behavior that can be well described, providing insight for biological membranes. A number of different studies are in agreement on general findings for some compositional phase diagrams, in particular, those that model the outer leaflet of animal cell plasma membranes. These model mixtures include cholesterol, together with one high-melting lipid and one low-melting lipid. An interesting finding is of two categories of such 3-component mixtures, leading to what we term Type I and Type II compositional phase diagrams. The latter have phase regions of macroscopic coexisting domains of [Lalpha+Lbeta+Lo] and of [Lalpha+Lo], with domains resolved under the light microscope. Type I mixtures have the same phase coexistence regions, but the domains seem to be nanoscopic. Type I mixtures are likely to be better models for biological membranes.


Figures

Fig. 1
Fig. 1
Compositional phase diagrams of 3-component bilayer mixtures that contain cholesterol together with a high-melting point lipid and a low-melting point lipid are useful models for animal cell plasma membrane outer leaflets. To date, the various mixtures of these types all seem to display the same pattern of phases. The most important distinction among such 3-component mixtures is the behavior designated here as Type I or Type II. The Type I mixtures have nanoscopic domain dimensions for the coexistence regions {Lα+Lo} and {Lα+Lβ+Lo}. Fluorescence microscope images giant unilamellar vesicles, GUVs, of the Type II mixtures reveal visible domains, whereas Type I mixtures appear uniform in these phase regions. The exact positions of the phase boundaries depend upon the particular lipids. Dashed lines for boundaries involving the solid Lβ phase indicate uncertainty as to whether the phase transition is first-order or higher order (continuous). Some lipids form the untilted solid Lβ phase as shown, others are in the solid tilted Lβ′ phase, and make a transition (not shown) to the Lβ phase. Although large regions of the composition space are found to have a single phase of Lα or Lo, these single phases might have local structure, as yet uncharacterized.

References

    1. van Meer G. Cellular lipidomics. EMBO J. 2005;24:3159–3165. - PMC - PubMed
    1. Wan C, Kiessling V, Tamm LK. Coupling of cholesterol-rich lipid phases in asymmetric bilayers. Biochemistry. 2008;47:2190–2198. - PubMed
    1. Putzel GG, Schick M. Phase behavior of a model bilayer membrane with coupled leaves. Biophys J. 2008;94:869–877. - PMC - PubMed
    1. Collins M, Keller SL. Tuning lipid mixtures to induce or suppress domain formation across leaflets of unsupported asymmetric bilayers. Proc Nat Acad Sci USA. 2008;105:124–128. - PMC - PubMed
    1. Young RM, Zheng X, Holowka D, Baird B. Reconstitution of regulated phosphorylation of FcepsilonRI by a lipid raft-excluded protein-tyrosine phosphatase. J Biol Chem. 2005;280:1230–1235. - PubMed

Publication types

LinkOut - more resources