

Myofiber angle distributions in the ovine left ventricle do not conform to computationally optimized predictions
- PMID: 18805536
- PMCID: PMC2612586
- DOI: 10.1016/j.jbiomech.2008.08.007
Myofiber angle distributions in the ovine left ventricle do not conform to computationally optimized predictions
Abstract
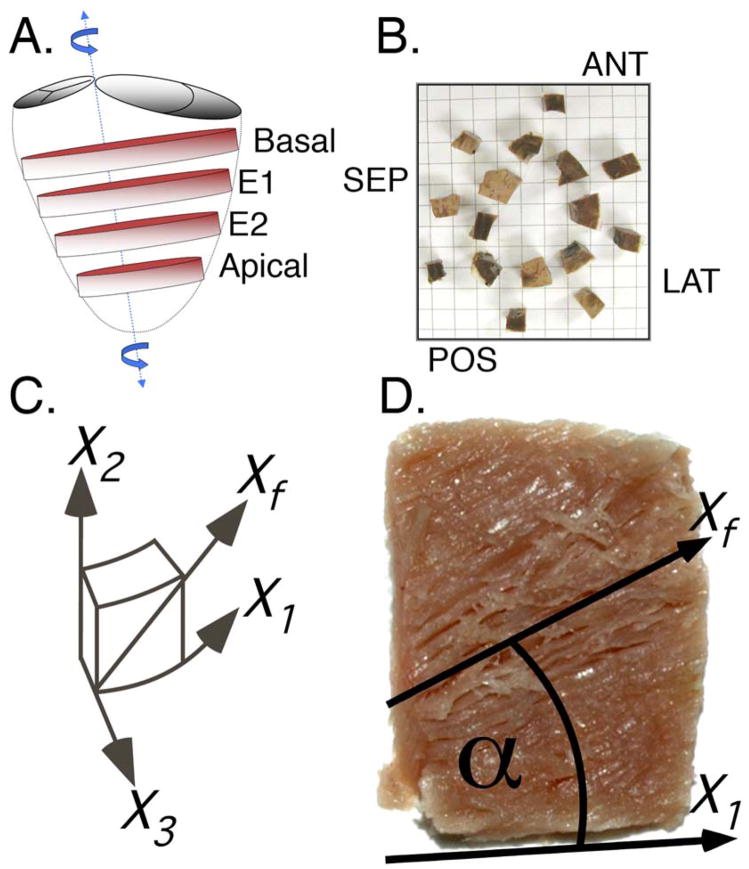
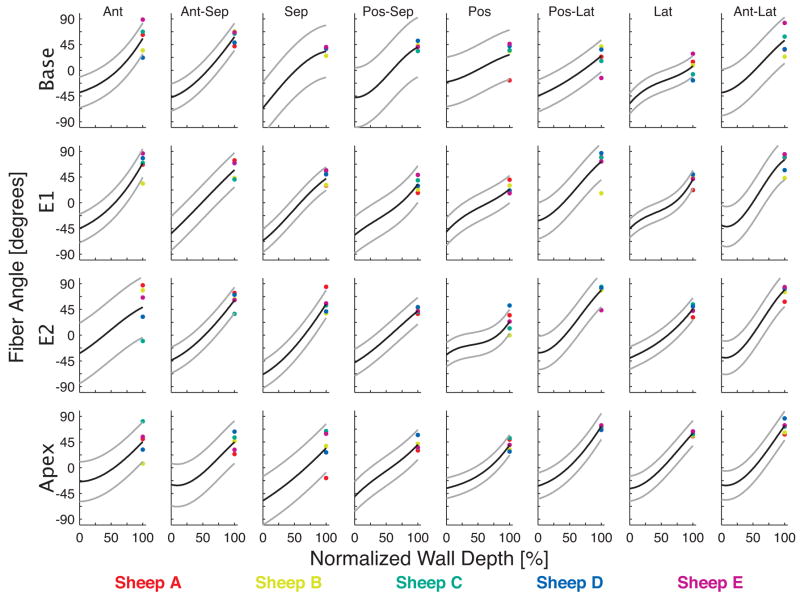
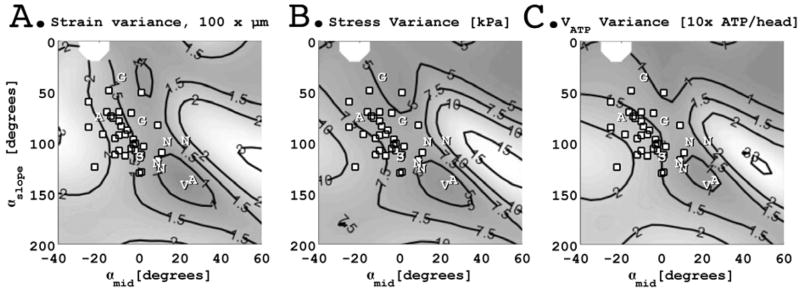
Recent computational models of optimized left ventricular (LV) myofiber geometry that minimize the spatial variance in sarcomere length, stress, and ATP consumption have predicted that a midwall myofiber angle of 20 degrees and transmural myofiber angle gradient of 140 degrees from epicardium to endocardium is a functionally optimal LV myofiber geometry. In order to test the extent to which actual fiber angle distributions conform to this prediction, we measured local myofiber angles at an average of nine transmural depths in each of 32 sites (4 short-axis levels, 8 circumferentially distributed blocks in each level) in five normal ovine LVs. We found: (1) a mean midwall myofiber angle of -7 degrees (SD 9), but with spatial heterogeneity (averaging 0 degrees in the posterolateral and anterolateral wall near the papillary muscles, and -9 degrees in all other regions); and (2) an average transmural gradient of 93 degrees (SD 21), but with spatial heterogeneity (averaging a low of 51 degrees in the basal posterior sector and a high of 130 degrees in the mid-equatorial anterolateral sector). We conclude that midwall myofiber angles and transmural myofiber angle gradients in the ovine heart are regionally non-uniform and differ significantly from the predictions of present-day computationally optimized LV myofiber models. Myofiber geometry in the ovine heart may differ from other species, but model assumptions also underlie the discrepancy between experimental and computational results. To test the predictive capability of the current computational model would we propose using an ovine specific LV geometry and comparing the computed myofiber orientations to those we report herein.
Figures
References
-
- Arts T, Bovendeerd P, Delhaas T, Prinzen F. Modeling the relation between cardiac pump function and myofiber mechanics. J Biomech. 2003;36(5):731–6. - PubMed
-
- Bovendeerd PH, Arts T, Huyghe JM, van Campen DH, Reneman RS. Dependence of local left ventricular wall mechanics on myocardial fiber orientation: a model study. J Biomech. 1992;25(10):1129–40. - PubMed
-
- Chen J, Liu W, Zhang H, Lacy L, Yang X, Song SK, Wickline SA, Yu X. Regional ventricular wall thickening reflects changes in cardiac fiber and sheet structure during contraction: quantification with diffusion tensor MRI. Am J Physiol Heart Circ Physiol. 2005;289(5):H1898–907. - PubMed
-
- Cheng A, Langer F, Rodriguez F, Criscione JC, Daughters GT, Miller DC, Ingels NB., Jr Transmural sheet strains in the lateral wall of the ovine left ventricle. Am J Physiol Heart Circ Physiol. 2005;289(3):H1234–41. - PubMed
Publication types
MeSH terms
Grants and funding
LinkOut - more resources
Full Text Sources
