Comparative Study
. 2008;59(14):3925-39.
doi: 10.1093/jxb/ern234. Epub 2008 Sep 19.

Involvement of Pinus taeda MYB1 and MYB8 in phenylpropanoid metabolism and secondary cell wall biogenesis: a comparative in planta analysis

Affiliations
Comparative Study

Involvement of Pinus taeda MYB1 and MYB8 in phenylpropanoid metabolism and secondary cell wall biogenesis: a comparative in planta analysis

Claude Bomal et al. J Exp Bot. 2008.

Abstract

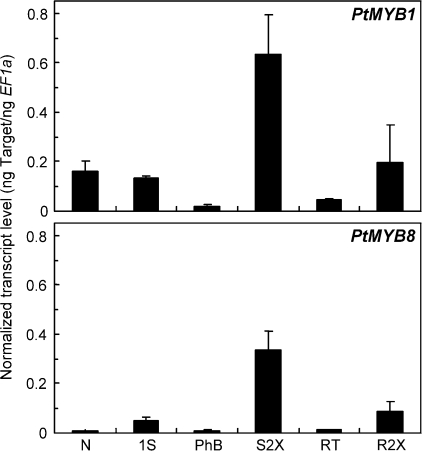
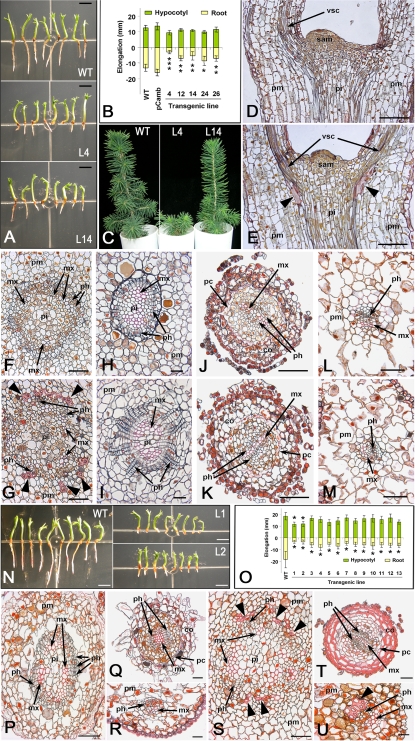
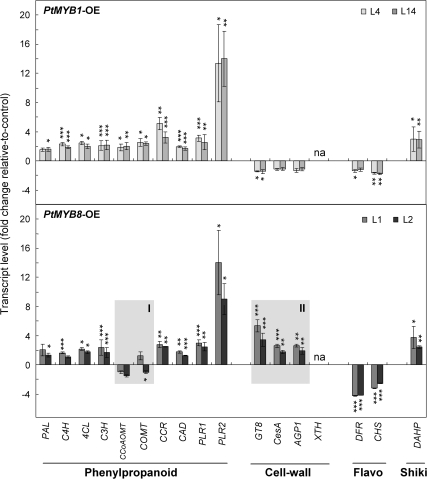
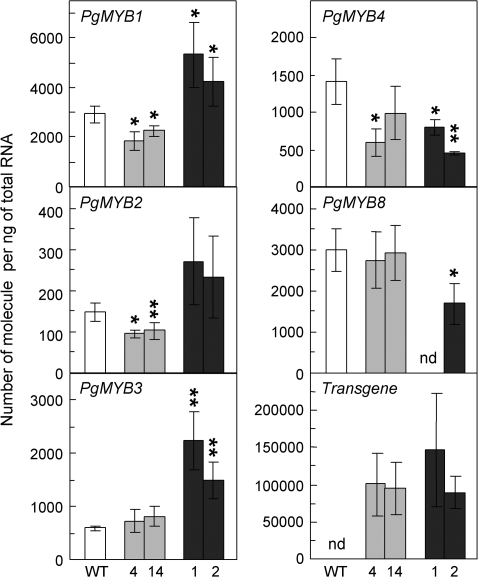
The involvement of two R2R3-MYB genes from Pinus taeda L., PtMYB1 and PtMYB8, in phenylpropanoid metabolism and secondary cell wall biogenesis was investigated in planta. These pine MYBs were constitutively overexpressed (OE) in Picea glauca (Moench) Voss, used as a heterologous conifer expression system. Morphological, histological, chemical (lignin and soluble phenols), and transcriptional analyses, i.e. microarray and reverse transcription quantitative PCR (RT-qPCR) were used for extensive phenotyping of MYB-overexpressing spruce plantlets. Upon germination of somatic embryos, root growth was reduced in both transgenics. Enhanced lignin deposition was also a common feature but ectopic secondary cell wall deposition was more strongly associated with PtMYB8-OE. Microarray and RT-qPCR data showed that overexpression of each MYB led to an overlapping up-regulation of many genes encoding phenylpropanoid enzymes involved in lignin monomer synthesis, while misregulation of several cell wall-related genes and other MYB transcription factors was specifically associated with PtMYB8-OE. Together, the results suggest that MYB1 and MYB8 may be part of a conserved transcriptional network involved in secondary cell wall deposition in conifers.


Figures

Fig. 1.
Fig. 1.
Transcript profiles of PtMYB1 and PtMYB8 in pine. Total RNA was isolated from various tissues of 2-year-old Pinus taeda trees. Transcript levels were determined by RT-qPCR from three biological replicates and were normalized relative to EF1-alpha expression level. Error bars represent standard deviation. N, Needle; 1S, primary shoot, corresponding to elongating shoot (no apical bud) with no sign of secondary growth; PhB, phloem-bark; S2X, shoot secondary xylem; RT, root tip; R2X, root secondary xylem.
Fig. 2.
Fig. 2.
Phenotypes induced by PtMYB1 and PtMYB8 overexpression in spruce. (A–M) PtMYB1-OE phenotypes: (A) 7-week-old in vitro plantlets in wild type (WT) and two independent PtMYB1-OE transgenic lines (L4, L14); (B) root and hypocotyl growth in 7-week-old plantlets produced from five independent PtMYB1-OE lines [significant differences in elongation between PtMYB1-OE lines and control one are indicated by asterisk according to Student's t-test at a level of 0.05 (*), 0.01 (**), or 0.001 (***)]; (C) plantlet morphology in wild type (WT) and two independent transgenic lines (L4, L14) of PtMYB1-OE transgenic spruce after transfer to soil; (D–M) 5 μm sections in hypocotyl, root, and needle of WT (D, F, H, J, L) and PtMYB1-OE (E, G, I, K, M) in vitro plantlets. Longitudinal (D, E) and cross- (F, G) sections in hypocotyl of 16-d-old in vitro plantlets. Sclerenchyma-like elements around the vascular cylinder are shown (black arrowheads) by pink staining characteristic of lignified cell walls (Sharman, 1943). Cross-sections in hypocotyl (H, I), root (J, K), and needle (L, M) are of 7-week-old plantlets. Supernumerary phloem cells can be observed in PtMYB1-OE section (I). No ectopic lignification was observed in root and needle of PtMYB1-OE transgenic spruce (K, M) compared with the control (J, L). (N–U) PtMYB8-OE phenotypes: (N) 7-week-old in vitro plantlets in WT and PtMYB8-OE independent transgenic lines (L1, L2); (O) root and hypocotyl growth in 7-week-old plantlets from 13 independent transgenic lines; no plantlet survived transfer to soil. Significant differences in elongation between PtMYB8-OE lines and the control one are indicated by an asterisk according to Student's t-test at a level of 0.01 (*). (P–U) Sections (5 μm) of paraffin-embedded hypocotyl (P, S), root (Q, T), and needle (R, U) in wild-type (P–R) and PtMYB8-OE (S–U) in vitro plantlets. Sclerenchyma-like elements around the vascular cylinder can be seen in the PtMYB8-OE transgenic (black arrowheads) in hypocotyl (S) and needle (U). Lignified cell wall staining (pink) was observed in parenchyma (S) and cortical (T) cells only in the transgenics. All histological sections were stained in safranin O–orange G–tannic acid after mordanting in 2% ZnCl2 (Sharman, 1943). Scale bars correspond to 5 mm (A, N), 50 μm (D, E, L, M, P, Q, S, T), 25 μm (F, G, R, U), 20 μm (H, I), and 100 μm (J, K). mx, metaxylem; ph, phloem; pm, parenchyma; pi, pith; co, cortex; pc, pericycle; sam, shoot apical meristem; vsc, vascular cells.
Fig. 3.
Fig. 3.
Lignin content and free phenolic profiles resulting from PtMYB1 and PtMYB8 overexpression in spruce. (A) Lignin content (± SD) of 7-week-old hypocotyls in wild type (WT) and transgenic spruce overexpressing PtMYB1 (L4, L14), and PtMYB8 (L1, L2). Lignin content was quantified by the AcBr method, expressed as a percentage of dry weight, acetone-extracted whole hypocotyls, and was calculated from three biological replicates per line and 10 plantlets per replicate. Asterisks indicate that transgenic means were significantly different from wild type, according to Student's t-test at P ≤0.05 (*) and P ≤0.01 (**). (B) HPLC profiles of low molecular weight phenolic compounds in 7-week-old wild-type (WT), and PtMYB1 and PtMYB8 overexpressing spruce (L4 and L1, respectively). IS, 3,4,5-Trimethoxycinnamic acid as internal standard.
Fig. 4.
Fig. 4.
Targeted RT-qPCR analysis in PtMYB1 and PtMYB8 transgenic plantlets: validation of microarray and expression data from genes related to secondary metabolism and cell wall assembly. Phenylpropanoid-related genes are phenylalanine ammonia-lyase (PAL), cinnamic acid 4-hydroxylase (C4H), 4-coumarate-CoA ligase (4CL), coumarate 3-hydroxylase (C3H), caffeate O-methyltransferase (COMT), caffeoyl-CoA 3-O-methyltransferase (CCoAOMT), cinnamoyl-CoA reductase (CCR), cinnamyl-alcohol dehydrogenase (CAD), and pinoresinol-lariciresinol reductase 1 and 2 (PLR1 and PLR2); cell wall-related genes are cellulose synthase (CesA), glycosyltransferase family 8 (GT8), arabinogalactan (AGP1), and xyloglucan endotransglycosylase/hydrolase (XTH). Flavonoid related genes (Flavo) are chalcone synthase (CHS), dihydroflavonol 4-reductase (DFR); the shikimate-related gene (Shiki) is 3-deoxy-D-arabino-heptulosonate 7-phosphate synthetase (DAHP). For both transgenics, transcript accumulation was assessed by RT-qPCR on 3-week-old plantlets produced from two independent transgenic lines for each gene construct (L4 and L14 for PtMYB1; L1 and L2 for PtMYB8). Transcript levels were determined from four biological replicates (25 plantlets per replicate) and were normalized relative to EF1-alpha expression level. Transcript levels were then expressed relative to control plants, and the significance of differential transcript accumulation was evaluated with Student's t-test (two-sample, unpaired, one-sided) at P ≤0.05 (*), P ≤0.01 (**), and P ≤0.001 (***). na, Not amplified in MYB transgenics.
Fig. 5.
Fig. 5.
Transcript accumulation of endogenous spruce MYBs and pine transgenes in wild-type and PtMYB1 and PtMYB8 transgenic plantlets. For both transgenics, transcript accumulation was assessed by RT-qPCR on 3-week-old plantlets produced from two independent transgenic lines (L4 and L14 for PtMYB1, grey columns; L1 and L2 for PtMYB8, black columns). Transcript levels were normalized relative to EF1a expression level and were calculated using standard curves as described by Rutledge and Côté (2003). Bars represent means (±SD) from three biological replicates (15 plantlets per replicate). nd, Not detected. The significance of differential transcript accumulation (up or down) between control and transgenic plantlets was evaluated with Student's t-test (two-sample, unpaired, one-sided) at P ≤0.05 (*), or P ≤0.01 (*).

Similar articles

Cited by

References

    1. Amthor J. Efficiency of lignin biosynthesis: a quantitative analysis. Annals of Botany. 2003;91:673–695. - PMC - PubMed
    1. Bedon F, Grima-Pettenati J, Mackay J. Conifer R2R3-MYB transcription factors: sequence analysis and gene expression in wood-forming tissues of white spruce (Picea glauca) BMC Plant Biology. 2007;7:17. - PMC - PubMed
    1. Benjamini Y, Hochberg Y. Controlling the false discovery rate: a practical and powerful approach to multiple testing. Journal of the Royal Statistical Society Series B. 1995;57:289–300.
    1. Björkmann A. Studies on finely divided wood. 1. Extraction of lignin with neutral solvents. Suen Papperstidn. 1956;59:477.
    1. Boerjan W, Ralph J, Baucher M. Lignin biosynthesis. Annual Reviews in Plant Biology. 2003;54:519–546. - PubMed

Publication types