

Characterization of protein dynamics in asymmetric cell division by scanning fluorescence correlation spectroscopy
- PMID: 18805921
- PMCID: PMC2586573
- DOI: 10.1529/biophysj.108.135152
Characterization of protein dynamics in asymmetric cell division by scanning fluorescence correlation spectroscopy
Abstract
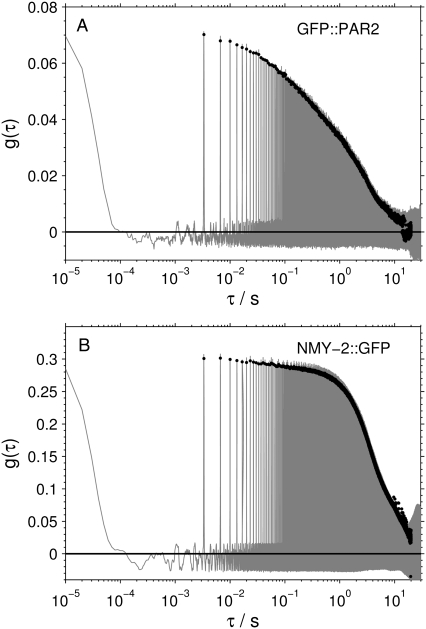
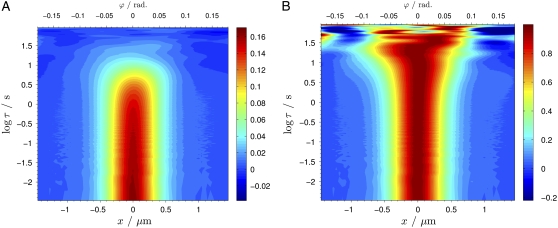
The development and differentiation of complex organisms from the single fertilized egg is regulated by a variety of processes that all rely on the distribution and interaction of proteins. Despite the tight regulation of these processes with respect to temporal and spatial protein localization, exact quantification of the underlying parameters, such as concentrations and distribution coefficients, has so far been problematic. Recent experiments suggest that fluorescence correlation spectroscopy on a single molecule level in living cells has great promise in revealing these parameters with high precision. The optically challenging situation in multicellular systems such as embryos can be ameliorated by two-photon excitation, where scattering background and cumulative photobleaching is limited. A more severe problem is posed by the large range of molecular mobilities observed at the same time, as standard FCS relies strongly on the presence of mobility-induced fluctuations. In this study, we overcame the limitations of standard FCS. We analyzed in vivo polarity protein PAR-2 from eggs of Caenorhabditis elegans by beam-scanning FCS in the cytosol and on the cortex of C. elegans before asymmetric cell division. The surprising result is that the distribution of PAR-2 is largely uncoupled from the movement of cytoskeletal components of the cortex. These results call for a more systematic future investigation of the different cortical elements, and show that the FCS technique can contribute to answering these questions, by providing a complementary approach that can reveal insights not obtainable by other techniques.
Figures


Similar articles
-
PAR-4/LKB1 mobilizes nonmuscle myosin through anillin to regulate C. elegans embryonic polarization and cytokinesis.Curr Biol. 2011 Feb 22;21(4):259-69. doi: 10.1016/j.cub.2011.01.010. Epub 2011 Jan 27. Curr Biol. 2011. PMID: 21276723
-
Translation of polarity cues into asymmetric spindle positioning in Caenorhabditis elegans embryos.Science. 2003 Jun 20;300(5627):1957-61. doi: 10.1126/science.1084146. Epub 2003 May 15. Science. 2003. PMID: 12750478
-
Acto-myosin reorganization and PAR polarity in C. elegans.Development. 2007 Mar;134(6):1035-43. doi: 10.1242/dev.000513. Epub 2007 Feb 7. Development. 2007. PMID: 17287245 Review.
-
The Role of Cytoplasmic MEX-5/6 Polarity in Asymmetric Cell Division.Bull Math Biol. 2021 Feb 17;83(4):29. doi: 10.1007/s11538-021-00860-0. Bull Math Biol. 2021. PMID: 33594535 Free PMC article.
-
Control of cell polarity and asymmetric division in C. elegans.Curr Top Dev Biol. 2012;101:55-76. doi: 10.1016/B978-0-12-394592-1.00003-X. Curr Top Dev Biol. 2012. PMID: 23140625 Review.
Cited by
-
FRAP analysis of membrane-associated proteins: lateral diffusion and membrane-cytoplasmic exchange.Biophys J. 2010 Oct 20;99(8):2443-52. doi: 10.1016/j.bpj.2010.08.033. Biophys J. 2010. PMID: 20959084 Free PMC article.
-
Determinants of myosin II cortical localization during cytokinesis.Curr Biol. 2010 Jun 22;20(12):1080-5. doi: 10.1016/j.cub.2010.04.058. Epub 2010 Jun 10. Curr Biol. 2010. PMID: 20541410 Free PMC article.
-
Fluorescence fluctuation spectroscopy: ushering in a new age of enlightenment for cellular dynamics.Biophys Rev. 2009 Sep 1;1(3):105-118. doi: 10.1007/s12551-009-0013-8. Biophys Rev. 2009. PMID: 21547245 Free PMC article.
-
PAR-3 oligomerization may provide an actin-independent mechanism to maintain distinct par protein domains in the early Caenorhabditis elegans embryo.Biophys J. 2011 Sep 21;101(6):1412-22. doi: 10.1016/j.bpj.2011.07.030. Epub 2011 Sep 20. Biophys J. 2011. PMID: 21943422 Free PMC article.
-
In vivo single-molecule imaging identifies altered dynamics of calcium channels in dystrophin-mutant C. elegans.Nat Commun. 2014 Sep 18;5:4974. doi: 10.1038/ncomms5974. Nat Commun. 2014. PMID: 25232639 Free PMC article.
References
-
- Cowan, C. R., and A. A. Hyman. 2004. Asymmetric cell division in C. elegans: cortical polarity and spindle positioning. Annu. Rev. Cell Dev. Biol. 20:427–453. - PubMed
-
- Schneider, S. Q., and B. Bowerman. 2003. Cell polarity and the cytoskeleton in the Caenorhabditis elegans zygote. Annu. Rev. Genet. 37:221–249. - PubMed
-
- Nance, J. 2005. PAR proteins and the establishment of cell polarity during C. elegans development. Bioessays. 27:126–135. - PubMed
-
- Munro, E. M. 2006. PAR proteins and the cytoskeleton: a marriage of equals. Curr. Opin. Cell Biol. 18:86–94. - PubMed
-
- Cheeks, R. J., J. C. Canman, W. N. Gabriel, N. Meyer, S. Strome, and B. Goldstein. 2004. C. elegans PAR proteins function by mobilizing and stabilizing asymmetrically localized protein complexes. Curr. Biol. 14:851–862. - PubMed
Publication types
MeSH terms
Substances
LinkOut - more resources
Full Text Sources
Miscellaneous
