

Gap junction coupling and calcium waves in the pancreatic islet
- PMID: 18805925
- PMCID: PMC2586567
- DOI: 10.1529/biophysj.108.140863
Gap junction coupling and calcium waves in the pancreatic islet
Abstract
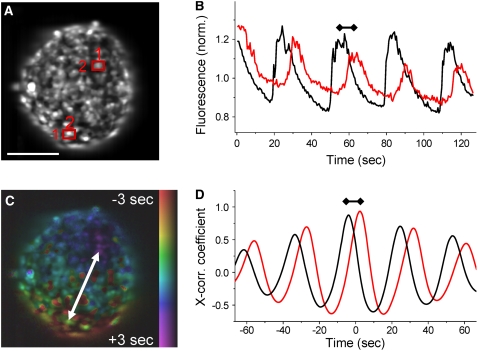
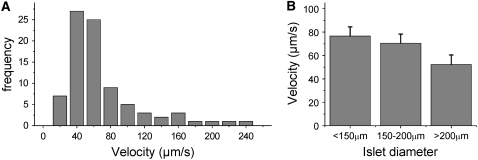
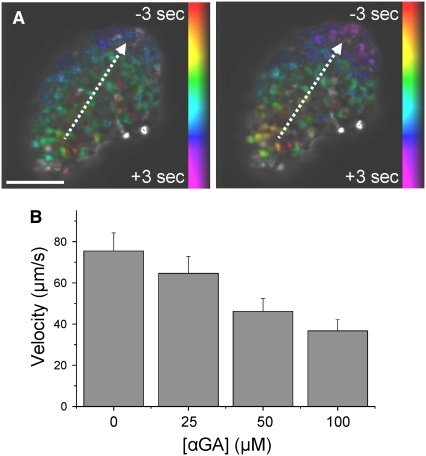
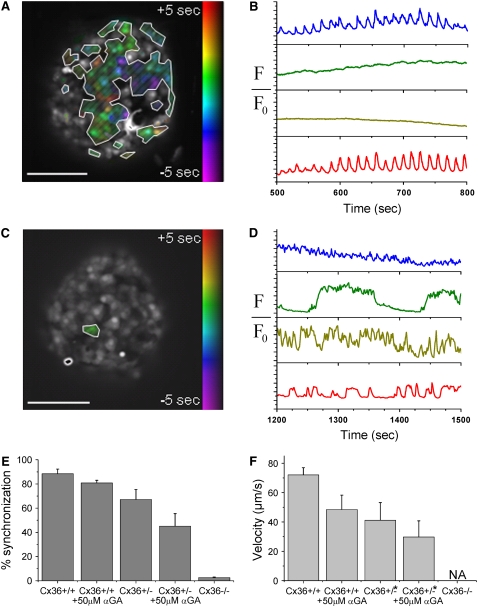
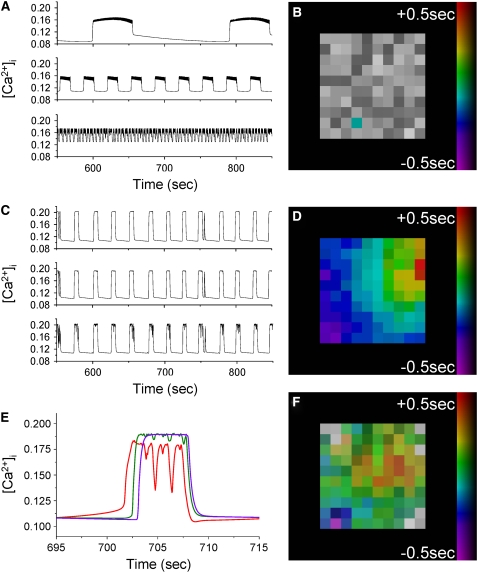
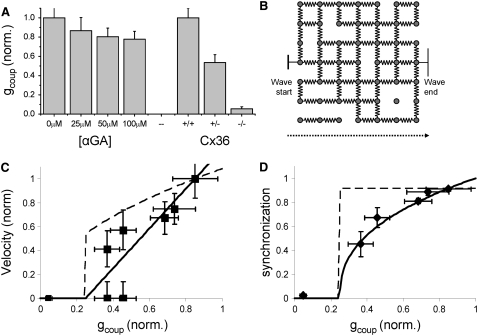
The pancreatic islet is a highly coupled, multicellular system that exhibits complex spatiotemporal electrical activity in response to elevated glucose levels. The emergent properties of islets, which differ from those arising in isolated islet cells, are believed to arise in part by gap junctional coupling, but the mechanisms through which this coupling occurs are poorly understood. To uncover these mechanisms, we have used both high-speed imaging and theoretical modeling of the electrical activity in pancreatic islets under a reduction in the gap junction mediated electrical coupling. Utilizing islets from a gap junction protein connexin 36 knockout mouse model together with chemical inhibitors, we can modulate the electrical coupling in the islet in a precise manner and quantify this modulation by electrophysiology measurements. We find that after a reduction in electrical coupling, calcium waves are slowed as well as disrupted, and the number of cells showing synchronous calcium oscillations is reduced. This behavior can be reproduced by computational modeling of a heterogeneous population of beta-cells with heterogeneous levels of electrical coupling. The resulting quantitative agreement between the data and analytical models of islet connectivity, using only a single free parameter, reveals the mechanistic underpinnings of the multicellular behavior of the islet.
Figures
Similar articles
-
Intrinsic islet heterogeneity and gap junction coupling determine spatiotemporal Ca²⁺ wave dynamics.Biophys J. 2014 Dec 2;107(11):2723-33. doi: 10.1016/j.bpj.2014.10.048. Epub 2014 Dec 2. Biophys J. 2014. PMID: 25468351 Free PMC article.
-
Fluorescence recovery after photobleaching reveals regulation and distribution of connexin36 gap junction coupling within mouse islets of Langerhans.J Physiol. 2014 Oct 15;592(20):4431-46. doi: 10.1113/jphysiol.2014.276733. Epub 2014 Aug 28. J Physiol. 2014. PMID: 25172942 Free PMC article.
-
Exendin-4 overcomes cytokine-induced decreases in gap junction coupling via protein kinase A and Epac2 in mouse and human islets.J Physiol. 2019 Jan;597(2):431-447. doi: 10.1113/JP276106. Epub 2018 Nov 29. J Physiol. 2019. PMID: 30412665 Free PMC article.
-
Connexins and microRNAs: Interlinked players in regulating islet function?Islets. 2017 Sep 3;9(5):99-108. doi: 10.1080/19382014.2017.1331192. Epub 2017 Jul 7. Islets. 2017. PMID: 28686518 Free PMC article. Review.
-
Do oscillations in pancreatic islets require pacemaker cells?J Biosci. 2022;47:14. J Biosci. 2022. PMID: 35212266 Review.
Cited by
-
Assessing Different Temporal Scales of Calcium Dynamics in Networks of Beta Cell Populations.Front Physiol. 2021 Mar 23;12:612233. doi: 10.3389/fphys.2021.612233. eCollection 2021. Front Physiol. 2021. PMID: 33833686 Free PMC article.
-
A mathematical model of β-cells in an islet of Langerhans sensing a glucose gradient.HFSP J. 2010 Apr;4(2):61-71. doi: 10.2976/1.3354862. Epub 2010 Apr 8. HFSP J. 2010. PMID: 20885774 Free PMC article.
-
Cell Systems Bioelectricity: How Different Intercellular Gap Junctions Could Regionalize a Multicellular Aggregate.Cancers (Basel). 2021 Oct 22;13(21):5300. doi: 10.3390/cancers13215300. Cancers (Basel). 2021. PMID: 34771463 Free PMC article.
-
Dimensionality and size scaling of coordinated Ca(2+) dynamics in MIN6 β-cell clusters.Biophys J. 2014 Jan 7;106(1):299-309. doi: 10.1016/j.bpj.2013.11.026. Biophys J. 2014. PMID: 24411262 Free PMC article.
-
Cooperative function of Pdx1 and Oc1 in multipotent pancreatic progenitors impacts postnatal islet maturation and adaptability.Am J Physiol Endocrinol Metab. 2018 Apr 1;314(4):E308-E321. doi: 10.1152/ajpendo.00260.2017. Epub 2017 Dec 12. Am J Physiol Endocrinol Metab. 2018. PMID: 29351489 Free PMC article.
References
-
- Atwater, I., L. Rosario, and E. Rojas. 1983. Properties of the Ca-activated K+ channel in pancreatic β-cells. Cell Calcium. 4:451–461. - PubMed
-
- Satin, L. S., and D. L. Cook. 1985. Voltage-gated Ca2+ current in pancreatic B-cells. Pflugers Archiv. 404:385–387. - PubMed
-
- Gilon, P., M. A. Ravier, J. C. Jonas, and J. C. Henquin. 2002. Control mechanisms of the oscillations of insulin secretion in vitro and in vivo. Diabetes. 51:S144–S151. - PubMed
-
- Lernmark, A. 1974. Preparation of, and studies on, free cell-suspensions from mouse pancreatic-islets. Diabetologia. 10:431–438. - PubMed
Publication types
MeSH terms
Substances
Grants and funding
LinkOut - more resources
Full Text Sources
Other Literature Sources
Miscellaneous
