. 2008 Dec 15;95(12):6052-9.
doi: 10.1529/biophysj.108.139139. Epub 2008 Sep 19.

Slow stress propagation in adherent cells

Affiliations

Slow stress propagation in adherent cells

Michael J Rosenbluth et al. Biophys J. .

Abstract

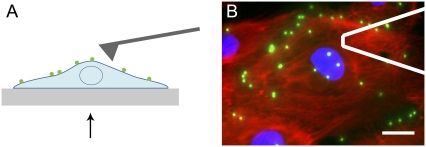
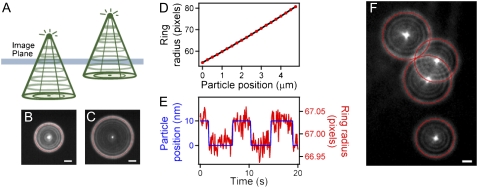
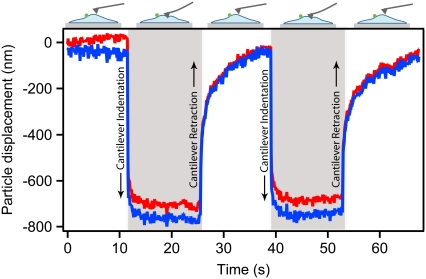
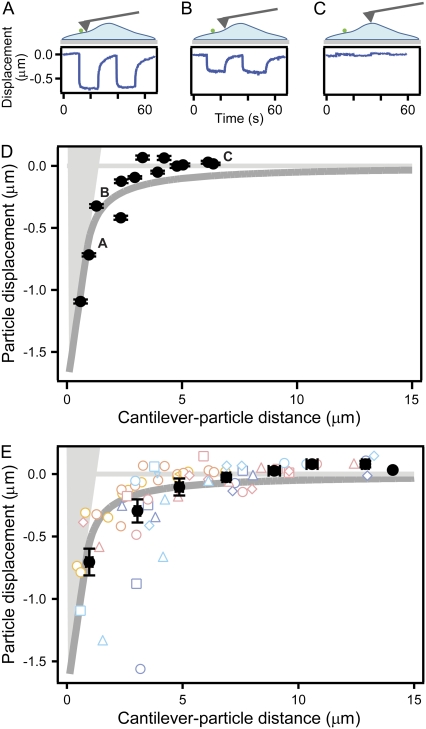
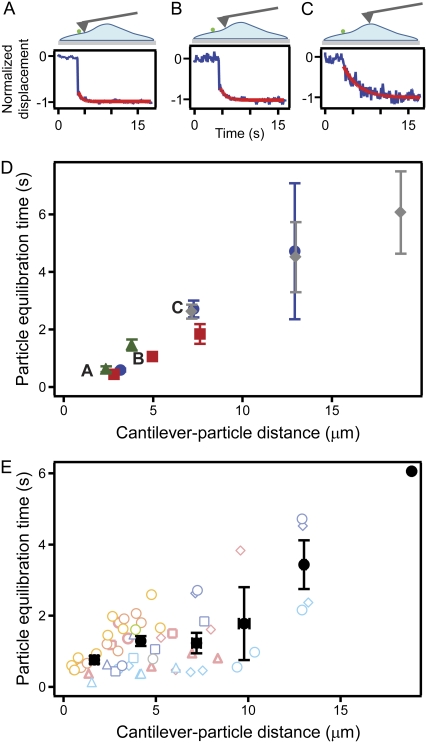
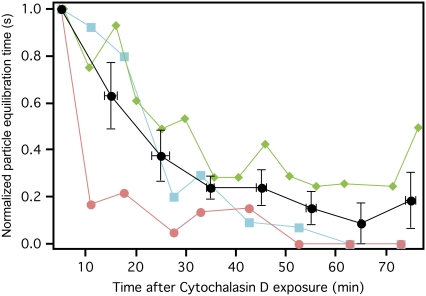
Mechanical cues influence a wide range of cellular behaviors including motility, differentiation, and tumorigenesis. Although previous studies elucidated the role of specific players such as ion channels and focal adhesions as local mechanosensors, the investigation of how mechanical perturbations propagate across the cell is necessary to understand the spatial coordination of cellular processes. Here we quantify the magnitude and timing of intracellular stress propagation, using atomic force microscopy and particle tracking by defocused fluorescence microscopy. The apical cell surface is locally perturbed by atomic force microscopy cantilever indentation, and distal displacements are measured in three dimensions by tracking integrin-bound fluorescent particles. We observe an immediate response and slower equilibration, occurring over times that increase with distance from perturbation. This distance-dependent equilibration occurs over several seconds and can be eliminated by disruption of the actin cytoskeleton. Our experimental results are not explained by traditional viscoelastic models of cell mechanics, but they are consistent with predictions from poroelastic models that include both cytoskeletal deformation and flow of the cytoplasm. Our combined atomic force microscopy-particle tracking measurements provide direct evidence of slow, distance-dependent dissipative stress propagation in response to external mechanical cues and offer new insights into mechanical models and physiological behaviors of adherent cells.


Figures

FIGURE 1
FIGURE 1
Combined AFM and defocused microscopy. (A) An AFM cantilever is used to locally indent the cell, and displacement of the cell surface is tracked in 3D by defocused epifluorescent microscopy of 500-nm fibronectin-coated fluorescent particles bound to the cell. Stage motion is controlled by a single-axis piezo-electric platform. Arrow in A indicates perspective of the objective. (B) Typical field of view, with AFM cantilever outlined in white. This endothelial cell was fixed and stained to show the nucleus (blue) and actin cytoskeleton (red), in addition to fluorescent particles (green). Scale bar, 15 μm.
FIGURE 2
FIGURE 2
Defocused multipoint 3D particle tracking in a single image plane. (A) A defocused fluorescent particle appears as concentric rings in the image plane. (B and C) Outer ring radius increases predictably with distance from object plane. (D) A particle is stepped in 250-nm increments away from the object plane, and the outer ring is fit with our modified Hough transform numerical technique. Using this method, we can track the z-position of the particle over a range of at least 5 μm. (E) A particle is subjected to 10-nm steps on a piezo-controlled platform, demonstrating the resolution of our technique. (F) Our modified Hough transform method allows for tracking of multiple, overlapping rings with up to 4-nm and 80-ms resolution. This analysis enables multipoint tracking of particles as close as 1.5 μm to each other in (x, y), which is essential for tracking multiple points on the same cell. Scale bars, 2 μm.
FIGURE 3
FIGURE 3
Cantilever indentation-retraction cycles induce particle displacement. Indentation and retraction of the AFM cantilever into the cell is repeated by moving the stage in 2-μm steps toward and away from the cantilever, with stage position held constant for 10–15 s after each step. A particle 2.5 μm away from the cantilever is displaced because of this indentation. The z displacement (red) accounts for the majority of total particle displacement (blue). Upon each cantilever step, an immediate fast response is evident, followed by slower equilibration approaching a final displacement. Upon cantilever retraction, the particle again displaces elastically, and then relaxes toward the original particle position.
FIGURE 4
FIGURE 4
Particle displacement magnitude decays in a distance-dependent manner. Displacement of a single particle on a cell was quantified as an AFM tip was stepped into the cell at distances ranging between 0–7 μm from the particle (AC, taken from D). (D) As distance from the tip increased, particle movement decayed toward zero, sometimes rising up at the farthest distances. Displacement magnitude was measured after particle relaxation. Error bars represent the fitting error of a flat line to equilibrated particle position, as recorded over several seconds. Dark gray curve represents predicted surface for a semi-infinite elastic half-space (37). The light-gray shaded area represents the cantilever tip. (E) When pooled, average displacement from n = 71 coupling instances (16 particles on seven cells) shows similar distance-dependent decay that closely follows the elastic model, although single points clearly exhibit heterogeneity. Error bars represent standard error of the mean. Each color point represents a different cell, and each shape represents a different particle.
FIGURE 5
FIGURE 5
Particle equilibration time increases with cantilever-particle distance. (AC) As distance between the indentation point and a particle increases, the particle takes a longer time to relax to equilibrium. Blue traces represent raw data, and red traces represent exponential fit to the data. (D) Four particles on a single cell showed increasing equilibration time with distance from perturbation when indented at three different positions. Data from each particle are represented by a different color and shape. Error bars represent the fitting error to a single exponential decay function. (E) Equilibration response of n = 57 coupling instances (16 particles on seven cells). Each cell is represented by a different color. Each particle on each cell is represented by a different shape. Average equilibration time is shown by black points, with error bars representing standard error of the mean.
FIGURE 6
FIGURE 6
Particle equilibration time decreases after cell exposure to cytochalasin D. In two separate experiments, a cell with at least one particle located several microns from the cantilever tip was exposed to cytochalasin D at time = 0 min. Indentation-retraction experiments were repeated at the same location every 5 min for over 1 h. Equilibration time of all three particles (three particles on two cells) decreased over time after exposure to cytochalasin D. Equilibration time for each particle is normalized by maximum observed equilibration time (first time point in all three cases), and represented by a different color and shape. Average normalized equilibration time is shown by the black points with error bars representing standard error of the mean.

Similar articles

Cited by

References

    1. Kasza, K. E., A. C. Rowat, J. Liu, T. E. Angelini, C. P. Brangwynne, G. H. Koenderink, and D. A. Weitz. 2007. The cell as a material. Curr. Opin. Cell Biol. 19:101–107. - PubMed
    1. Fabry, B., G. N. Maksym, J. P. Butler, M. Glogauer, D. Navajas, and J. J. Fredberg. 2001. Scaling the microrheology of living cells. Phys. Rev. Lett. 87:148102. - PubMed
    1. Hoffman, B. D., G. Massiera, K. M. Van Citters, and J. C. Crocker. 2006. The consensus mechanics of cultured mammalian cells. Proc. Natl. Acad. Sci. USA. 103:10259–10264. - PMC - PubMed
    1. Bursac, P., G. Lenormand, B. Fabry, M. Oliver, D. A. Weitz, V. Viasnoff, J. P. Butler, and J. J. Fredberg. 2005. Cytoskeletal remodelling and slow dynamics in the living cell. Nat. Mater. 4:557–561. - PubMed
    1. Trepat, X., L. Deng, S. S. An, D. Navajas, D. J. Tschumperlin, W. T. Gerthoffer, J. P. Butler, and J. J. Fredberg. 2007. Universal physical responses to stretch in the living cell. Nature. 447:592–595. - PMC - PubMed

Publication types

LinkOut - more resources