

Probing the dynamic organization of transcription compartments and gene loci within the nucleus of living cells
- PMID: 18805931
- PMCID: PMC2586563
- DOI: 10.1529/biophysj.108.135921
Probing the dynamic organization of transcription compartments and gene loci within the nucleus of living cells
Abstract
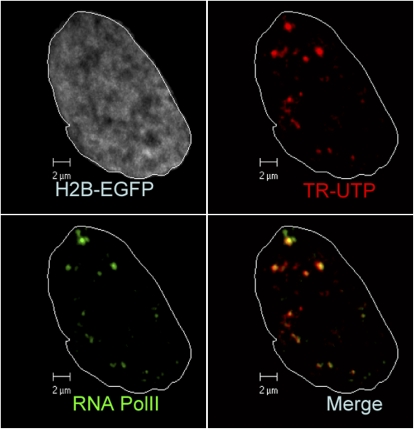
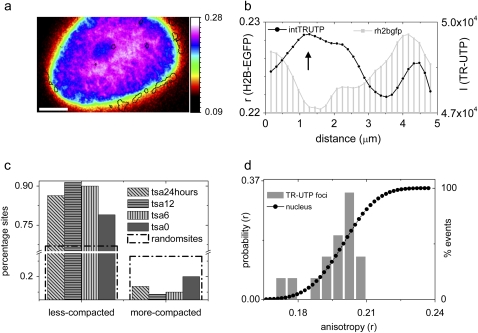
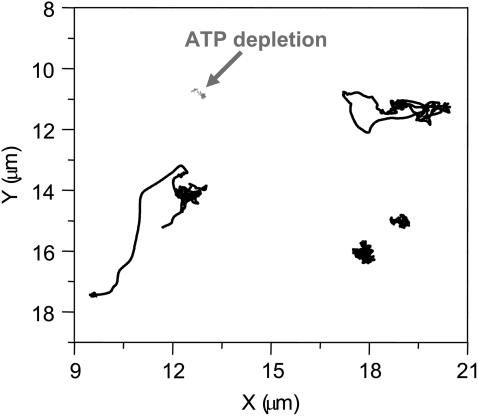
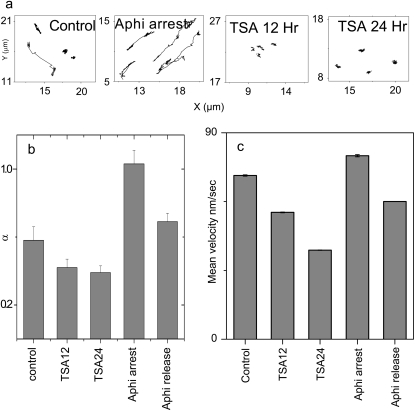
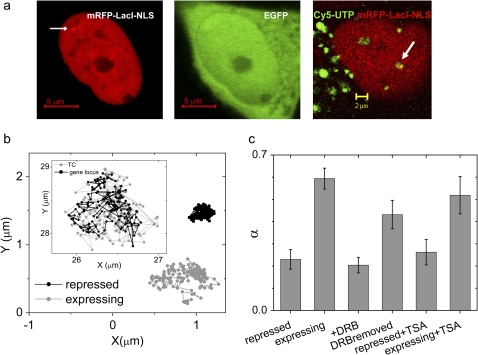
The three-dimensional organization of nuclear compartments within living cells determines genome function and yet their underlying self-organizing principles are unclear. We visualize in real-time transcriptionally active compartments (TCs) by the transient enrichment of fluorescently-labeled uridine 5'-triphosphate molecules within living cells. These TCs partially colocalize with active RNA-Pol II in the cell nucleus. Fluorescence anisotropy maps of chromatin compaction evidences a more open chromatin structure at the TCs. Using live-cell timelapse imaging, heterogeneity in the dynamic behavior of TCs has been revealed which falls into three distinct classes: subdiffusive, super-diffusive, and normal diffusive behavior. In contrast, the mobility of a candidate gene locus, either in the repressed or activated state, undergoes a differential restricted motion that is coupled to TC movement. Further TC dynamics is directly affected by small molecule chromatin structure modulators and adenosine triphosphate depletion. This heterogeneous behavior in TC dynamics within living cells could provide an interesting paradigm to explore the spatiotemporal dimension to gene transcription control.
Figures
Similar articles
-
Dynamic organization of transcription compartments is dependent on functional nuclear architecture.Biophys J. 2012 Sep 5;103(5):851-9. doi: 10.1016/j.bpj.2012.06.036. Biophys J. 2012. PMID: 23009834 Free PMC article.
-
Chromatin structure exhibits spatio-temporal heterogeneity within the cell nucleus.Biophys J. 2006 Sep 15;91(6):2297-303. doi: 10.1529/biophysj.105.079525. Epub 2006 Jun 30. Biophys J. 2006. PMID: 16815897 Free PMC article.
-
4-D single particle tracking of synthetic and proteinaceous microspheres reveals preferential movement of nuclear particles along chromatin - poor tracks.BMC Cell Biol. 2004 Nov 23;5:45. doi: 10.1186/1471-2121-5-45. BMC Cell Biol. 2004. PMID: 15560848 Free PMC article.
-
Nuclear organization of RNA polymerase II transcription.Biochem Cell Biol. 2013 Feb;91(1):22-30. doi: 10.1139/bcb-2012-0059. Epub 2013 Feb 5. Biochem Cell Biol. 2013. PMID: 23442138 Review.
-
Nuclear architecture by RNA.Curr Opin Genet Dev. 2012 Apr;22(2):179-87. doi: 10.1016/j.gde.2011.12.005. Epub 2012 Jan 24. Curr Opin Genet Dev. 2012. PMID: 22281031 Review.
Cited by
-
Chromosome positioning from activity-based segregation.Nucleic Acids Res. 2014 Apr;42(7):4145-59. doi: 10.1093/nar/gkt1417. Epub 2014 Jan 22. Nucleic Acids Res. 2014. PMID: 24459132 Free PMC article.
-
Dynamic organization of transcription compartments is dependent on functional nuclear architecture.Biophys J. 2012 Sep 5;103(5):851-9. doi: 10.1016/j.bpj.2012.06.036. Biophys J. 2012. PMID: 23009834 Free PMC article.
-
Transcription-dependent mobility of single genes and genome-wide motions in live human cells.Nat Commun. 2024 Oct 22;15(1):8879. doi: 10.1038/s41467-024-51149-4. Nat Commun. 2024. PMID: 39438437 Free PMC article.
-
Dynamics of passive and active particles in the cell nucleus.PLoS One. 2012;7(10):e45843. doi: 10.1371/journal.pone.0045843. Epub 2012 Oct 15. PLoS One. 2012. PMID: 23077497 Free PMC article.
-
Chromosome Territorial Organization Drives Efficient Protein Complex Formation: A Hypothesis.Yale J Biol Med. 2019 Sep 20;92(3):541-548. eCollection 2019 Sep. Yale J Biol Med. 2019. PMID: 31543715 Free PMC article. Review.
References
-
- Misteli, T. 2007. Beyond the sequence: cellular organization of genome function. Cell. 128:787–800. - PubMed
-
- Lanctot, C., T. Cheutin, M. Cremer, G. Cavalli, and T. Cremer. 2007. Dynamic genome architecture in the nuclear space: regulation of gene expression in three dimensions. Nat. Rev. Genet. 8:104–115. - PubMed
-
- Sproul, D., N. Gilbert, and W. A. Bickmore. 2005. The role of chromatin structure in regulating the expression of clustered genes. Nat. Rev. Genet. 6:775–781. - PubMed
-
- Chakalova, L., E. Debrand, J. A. Mitchell, C. S. Osborne, and P. Fraser. 2005. Replication and transcription: shaping the landscape of the genome. Nat. Rev. Genet. 6:669–677. - PubMed
-
- Gruenbaum, Y., A. Margalit, R. D. Goldman, D. K. Shumaker, and K. L. Wilson. 2005. The nuclear lamina comes of age. Nat. Rev. Mol. Cell Biol. 6:21–31. - PubMed
Publication types
MeSH terms
Substances
LinkOut - more resources
Full Text Sources
Medical
