. 2008 Dec 15;95(12):5843-50.
doi: 10.1529/biophysj.108.136879. Epub 2008 Sep 19.

Azide as a probe of proton transfer reactions in photosynthetic oxygen evolution

Affiliations

Azide as a probe of proton transfer reactions in photosynthetic oxygen evolution

Ian B Cooper et al. Biophys J. .

Abstract

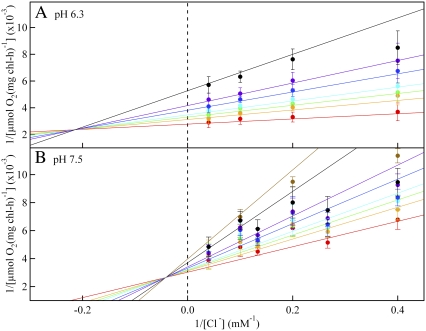
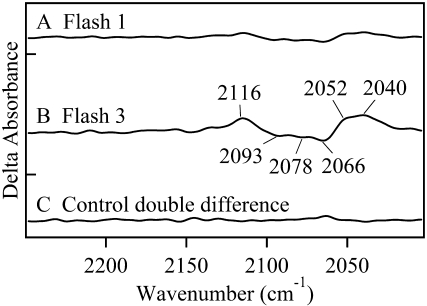
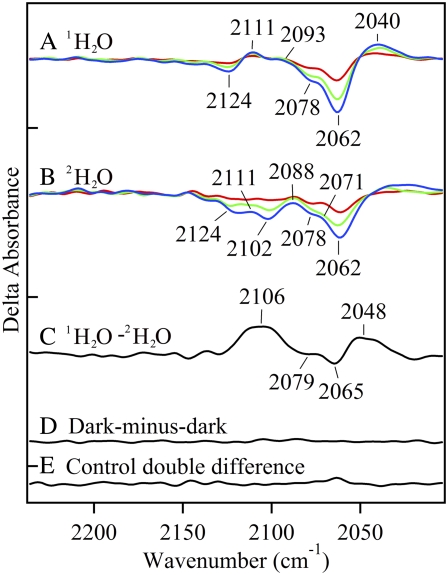
In oxygenic photosynthesis, photosystem II (PSII) is the multisubunit membrane protein responsible for the oxidation of water to O2 and the reduction of plastoquinone to plastoquinol. One electron charge separation in the PSII reaction center is coupled to sequential oxidation reactions at the oxygen-evolving complex (OEC), which is composed of four manganese ions and one calcium ion. The sequentially oxidized forms of the OEC are referred to as the S(n) states. S(1) is the dark-adapted state of the OEC. Flash-induced oxygen production oscillates with period four and occurs during the S(3) to S(0) transition. Chloride plays an important, but poorly understood role in photosynthetic water oxidation. Chloride removal is known to block manganese oxidation during the S(2) to S(3) transition. In this work, we have used azide as a probe of proton transfer reactions in PSII. PSII was sulfate-treated to deplete chloride and then treated with azide. Steady state oxygen evolution measurements demonstrate that azide inhibits oxygen evolution in a chloride-dependent manner and that azide is a mixed or noncompetitive inhibitor. This result is consistent with two azide binding sites, one at which azide competes with chloride and one at which azide and chloride do not compete. At pH 7.5, the K(i) for the competing site was estimated as 1 mM, and the K(i)' for the uncompetitive site was estimated as 8 mM. Vibrational spectroscopy was then used to monitor perturbations in the frequency and amplitude of the azide antisymmetric stretching band. These changes were induced by laser-induced charge separation in the PSII reaction center. The results suggest that azide is involved in proton transfer reactions, which occur before manganese oxidation, on the donor side of chloride-depleted PSII.


Figures

FIGURE 1
FIGURE 1
Lineweaver-Burk double-reciprocal plots, considering chloride as the substrate and showing the inhibitory effect of azide on PSII oxygen evolution activity. PSII was treated with sulfate to deplete chloride, and the PSII sample was then treated with 0 (red), 0.25 (orange), 0.38 (green), 0.50 (light blue), 0.75 (dark blue), or 1.0 (purple), 1.8 (black), and 2.5 (brown; pH 7.5 only) mM formula image In A, the assay conditions were taken from reference (38) and employed 400 mM sucrose, 50 mM MES-NaOH, pH 6.3, and 2 mM recrystallized PPBQ. In B, the assay conditions were 400 mM sucrose, 50 mM HEPES-NaOH, pH 7.5, and 2 mM recrystallized PPBQ. The concentrations of chloride and azide were adjusted by addition from 1 M NaCl and 100 mM NaN3 stock solutions, respectively, in the appropriate assay buffer. Error bars represent 1 SD. The color coded, superimposed lines were generated with Vmax, Km, Ki, and Ki′ values, derived from fits to the hyperbolic oxygen evolution plots (see Results section and the Supplementary Material, Data S1). The double reciprocal plots were fit with the equation formula image
FIGURE 2
FIGURE 2
Difference FT-IR spectra showing flash-induced perturbation of the azide antisymmetric stretching band in untreated, manganese-depleted, or chloride-depleted PSII samples. Difference spectra were created by ratio of data taken before and after flash excitation, followed by conversion to absorbance. In A–E, the results of three consecutive 532 nm laser flashes to a preflashed, dark-adapted PSII sample are presented in red (flash 1), green (flash 2), and blue (flash 3). In A, untreated PSII contained 400 mM sucrose, 50 mM MES-NaOH, pH 6.0, and 15 mM NaCl (average of 12). In B, untreated PSII contained in 400 mM sucrose, 50 mM HEPES-NaOH, pH 7.5 (pH 7.5 buffer) (average of 15). In C, manganese-depleted PSII contained pH 7.5 buffer (average of 38). In D and E, chloride-depleted PSII contained pH 7.5 buffer (average of 39). In A-D, the sample also contained 15 mM formula image In E, chloride-depleted PSII in pH 7.5 buffer contained 15 mM [15N(14N)2] (average of 21). In F, a dark-minus-dark control was generated from the data set in D. Delta absorbance on the y axis indicates that the spectra show changes in absorbance. All samples contained 1.5 mM recrystallized DCBQ. The tick marks on the y axis represent 5 × 10⁻⁴ AU.
FIGURE 3
FIGURE 3
Double difference FT-IR spectra showing perturbations of azide antisymmetric stretching bands. To identify any structural changes at the OEC azide site, manganese-depleted PSII data were subtracted from chloride-depleted PSII data. These double difference spectra were created by subtraction of data shown in Fig. 2, C and D. In A, subtracted spectra were acquired with one laser flash (Fig. 2, C and D, red). In B, subtracted spectra were acquired with three laser flashes (Fig. 2, C and D, blue). In C, a control double difference spectrum, in which no vibrational bands are expected, was generated by subtraction of one half of the data in (Fig. 2 D, red) from the other half of the data set and dividing by the square root of two. Delta absorbance on the y axis indicates that the spectra show changes in absorbance. All samples contained 1.5 mM recrystallized DCBQ. The tick marks on the y axis represent 5 × 10⁻⁴ AU.
FIGURE 4
FIGURE 4
Difference FT-IR spectra showing the effect of solvent isotope exchange on the azide antisymmetric stretching band in chloride-depleted PSII samples. Difference spectra were created by ratio of data taken before and after flash excitation, followed by conversion to absorbance. In A and B, the results of three consecutive 532 nm laser flashes to a preflashed, dark adapted PSII sample are presented in red (flash 1), green (flash 2), and blue (flash 3). In A, chloride-depleted PSII in 1H2O p1H 7.5 buffer contained 15 mM formula image (average of 39). In B, chloride-depleted PSII in 2H2O p2H 7.5 buffer contained 15 mM formula image (average of 26). In C, an isotope-edited, 1H2O-minus-2H2O, double difference spectrum was generated by subtracting (B, flash 3, blue) from (A, flash 3, blue). In D, a dark-minus-dark control was generated from the data set in A. In E, a control double difference spectrum, in which no vibrational bands are expected, was generated by subtraction of one half of the data in A from the other half of the data set and dividing by the square root of two. Delta absorbance on the y axis indicates that the spectra show changes in absorbance. All samples contained 1.5 mM recrystallized DCBQ. The tick marks on the y axis represent 5 × 10⁻⁴ AU.

Similar articles

Cited by

References

    1. Nelson, N., and C. F. Yocum. 2006. Structure and function of photosystems I and II. Annu. Rev. Plant Biol. 57:521–565. - PubMed
    1. Yocum, C. F. 2008. The calcium and chloride requirements of the O2 evolving complex. Coord. Chem. Rev. 252:296–305.
    1. Zouni, A., H.-T. Witt, J. Kern, P. Fromme, N. Krauß, W. Saenger, and P. Orth. 2001. Crystal structure of photosystem II from Synechococcus elongatus at 3.8 Å resolution. Nature. 409:739–743. - PubMed
    1. Kamiya, N., and J.-R. Shen. 2003. Crystal structure of oxygen-evolving photosystem II from Thermosynechococcus vulcanus at 3.7 Å resolution. Proc. Natl. Acad. Sci. USA. 100:98–103. - PMC - PubMed
    1. Biesiadka, J., B. Loll, J. Kern, K.-D. Irrgang, and A. Zouni. 2004. Crystal structure of cyanobacterial photosystem II at 3.2 Å resolution: a closer look at the Mn-cluster. Phys. Chem. Chem. Phys. 6:4733–4736.

Publication types

MeSH terms

LinkOut - more resources