

Tryptophan mutations at azi-etomidate photo-incorporation sites on alpha1 or beta2 subunits enhance GABAA receptor gating and reduce etomidate modulation
- PMID: 18805938
- PMCID: PMC2596762
- DOI: 10.1124/mol.108.050500
Tryptophan mutations at azi-etomidate photo-incorporation sites on alpha1 or beta2 subunits enhance GABAA receptor gating and reduce etomidate modulation
Abstract
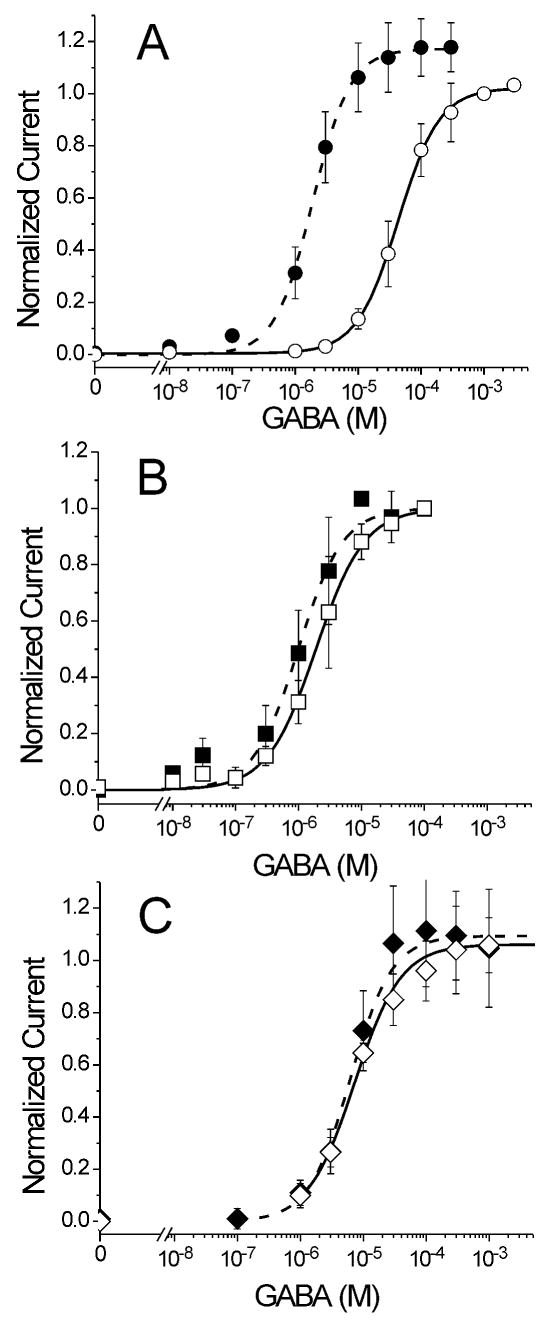
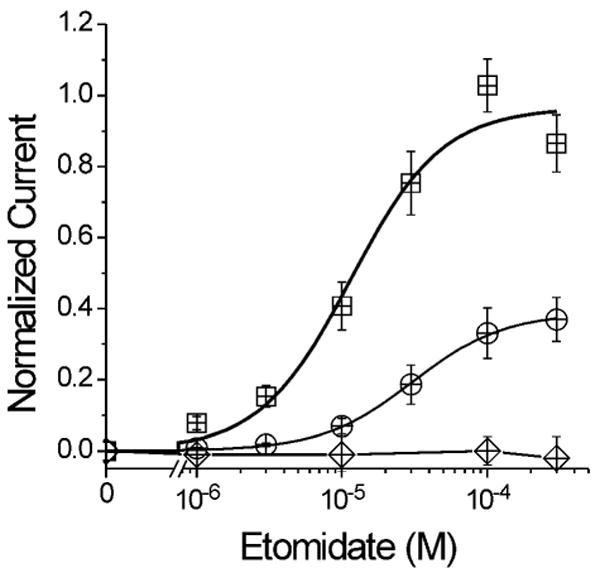
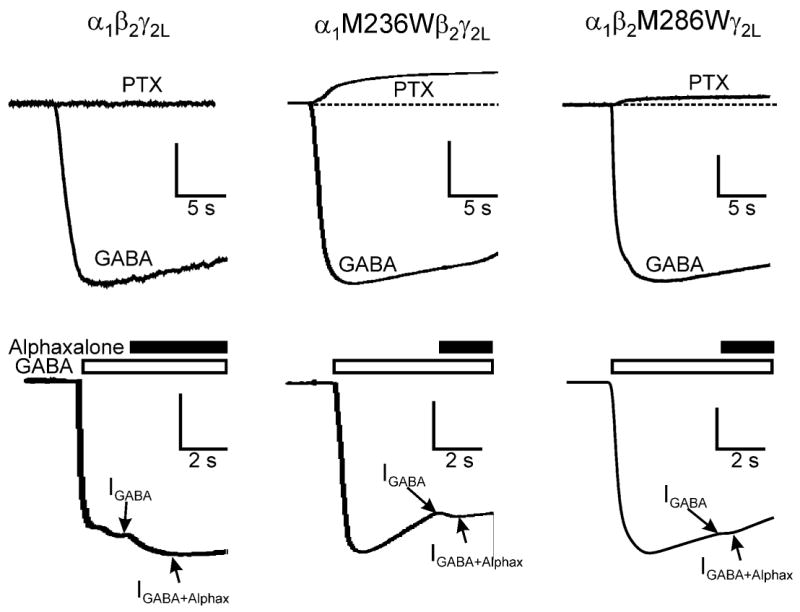
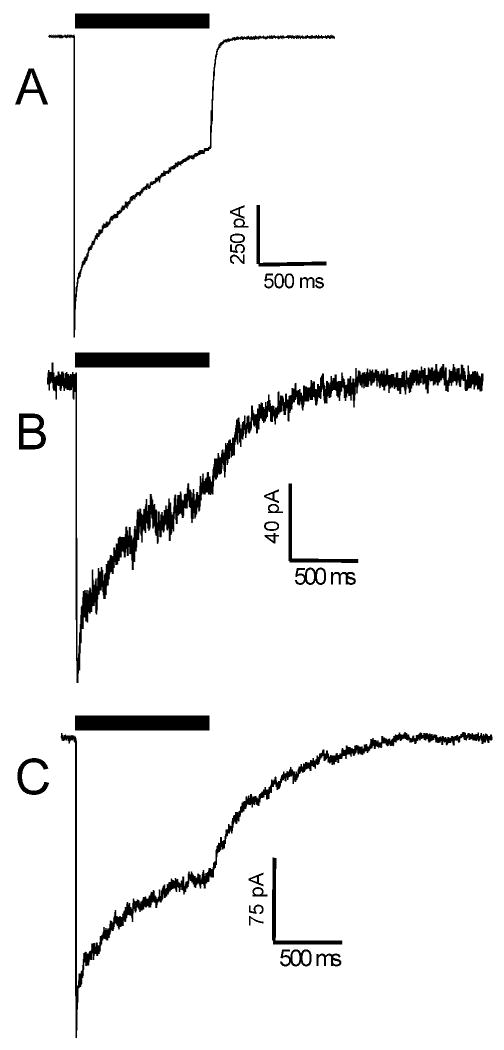
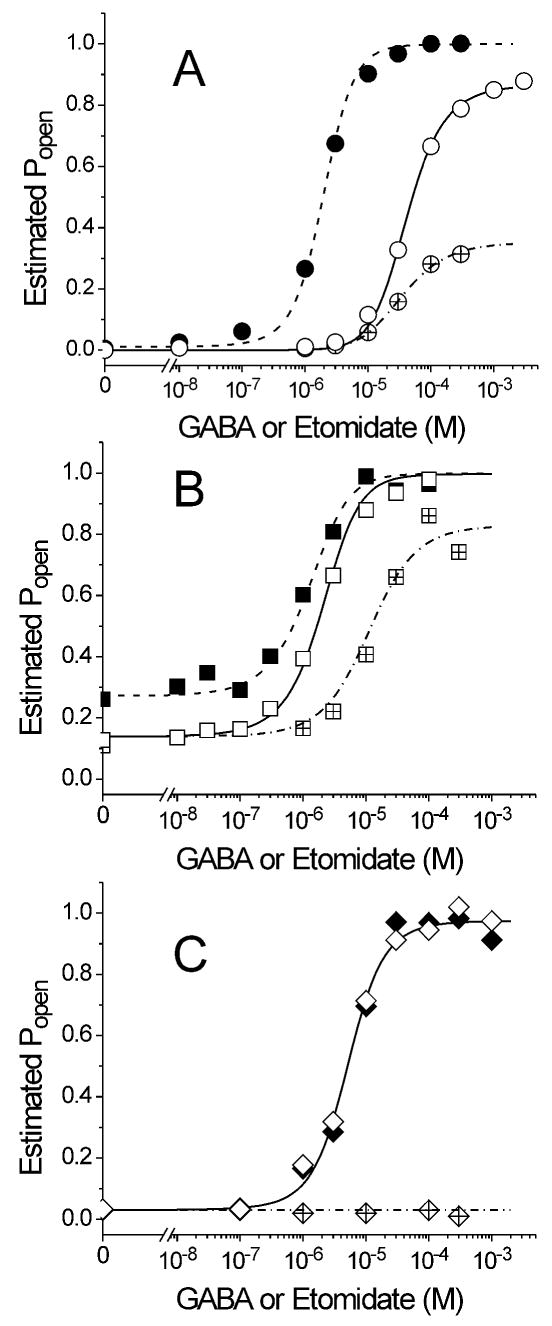
The potent general anesthetic etomidate produces its effects by enhancing GABA(A) receptor activation. Its photolabel analog [(3)H]azi-etomidate labels residues within transmembrane domains on alpha and beta subunits: alphaMet236 and betaMet286. We hypothesized that these methionines contribute to etomidate sites formed at alpha-beta subunit interfaces and that increasing side-chain bulk and hydrophobicity at either locus would mimic etomidate binding and block etomidate effects. Channel activity was electrophysiologically quantified in alpha(1)beta(2)gamma(2L) receptors with alpha(1)M236W or beta(2)M286W mutations, in both the absence and the presence of etomidate. Measurements included spontaneous activation, GABA EC(50), etomidate agonist potentiation, etomidate direct activation, and rapid macrocurrent kinetics. Both alpha(1)M236W and beta(2)M286W mutations induced spontaneous channel opening, lowered GABA EC(50), increased maximal GABA efficacy, and slowed current deactivation, mimicking effects of etomidate on alpha(1)beta(2)gamma(2L) channels. These changes were larger with alpha(1)M236W than with beta(2)M286W. Etomidate (3.2 muM) reduced GABA EC(50) much less in alpha(1)M236Wbeta(2)gamma(2L) receptors (2-fold) than in wild type (23-fold). However, etomidate was more potent and efficacious in directly activating alpha(1)M236Wbeta(2)gamma(2L) compared with wild type. In alpha(1)beta(2)M286Wgamma(2L) receptors, etomidate induced neither agonist-potentiation nor direct channel activation. These results support the hypothesis that alpha(1)Met236 and beta(2)Met286 are within etomidate sites that allosterically link to channel gating. Although alpha(1)M236W produced the larger impact on channel gating, beta(2)M286W produced more profound changes in etomidate sensitivity, suggesting a dominant role in drug binding. Furthermore, quantitative mechanistic analysis demonstrated that wild-type and mutant results are consistent with the presence of only one class of etomidate sites mediating both agonist potentiation and direct activation.
Figures
Similar articles
-
Photo-activated azi-etomidate, a general anesthetic photolabel, irreversibly enhances gating and desensitization of gamma-aminobutyric acid type A receptors.Anesthesiology. 2008 Jan;108(1):103-12. doi: 10.1097/01.anes.0000296074.33999.52. Anesthesiology. 2008. PMID: 18156888 Free PMC article.
-
Gamma-amino butyric acid type A receptor mutations at beta2N265 alter etomidate efficacy while preserving basal and agonist-dependent activity.Anesthesiology. 2009 Oct;111(4):774-84. doi: 10.1097/ALN.0b013e3181b55fae. Anesthesiology. 2009. PMID: 19741491 Free PMC article.
-
p-Trifluoromethyldiazirinyl-etomidate: a potent photoreactive general anesthetic derivative of etomidate that is selective for ligand-gated cationic ion channels.J Med Chem. 2010 Sep 9;53(17):6432-44. doi: 10.1021/jm100498u. J Med Chem. 2010. PMID: 20704351 Free PMC article.
-
Anesthetic sites and allosteric mechanisms of action on Cys-loop ligand-gated ion channels.Can J Anaesth. 2011 Feb;58(2):191-205. doi: 10.1007/s12630-010-9419-9. Epub 2011 Jan 7. Can J Anaesth. 2011. PMID: 21213095 Free PMC article. Review.
-
GABA(A) receptors as molecular targets of general anesthetics: identification of binding sites provides clues to allosteric modulation.Can J Anaesth. 2011 Feb;58(2):206-15. doi: 10.1007/s12630-010-9429-7. Epub 2010 Dec 31. Can J Anaesth. 2011. PMID: 21194017 Free PMC article. Review.
Cited by
-
Etomidate and Etomidate Analog Binding and Positive Modulation of γ-Aminobutyric Acid Type A Receptors: Evidence for a State-dependent Cutoff Effect.Anesthesiology. 2018 Nov;129(5):959-969. doi: 10.1097/ALN.0000000000002356. Anesthesiology. 2018. PMID: 30052529 Free PMC article.
-
Comparison of αβδ and αβγ GABAA receptors: Allosteric modulation and identification of subunit arrangement by site-selective general anesthetics.Pharmacol Res. 2018 Jul;133:289-300. doi: 10.1016/j.phrs.2017.12.031. Epub 2017 Dec 30. Pharmacol Res. 2018. PMID: 29294355 Free PMC article. Review.
-
Structural insights into GABAA receptor potentiation by Quaalude.Nat Commun. 2024 Jun 19;15(1):5244. doi: 10.1038/s41467-024-49471-y. Nat Commun. 2024. PMID: 38898000 Free PMC article.
-
High Constitutive Activity Accounts for the Combination of Enhanced Direct Activation and Reduced Potentiation in Mutated GABAA Receptors.Mol Pharmacol. 2018 May;93(5):468-476. doi: 10.1124/mol.117.111435. Epub 2018 Feb 8. Mol Pharmacol. 2018. PMID: 29439087 Free PMC article.
-
Kavain, the Major Constituent of the Anxiolytic Kava Extract, Potentiates GABAA Receptors: Functional Characteristics and Molecular Mechanism.PLoS One. 2016 Jun 22;11(6):e0157700. doi: 10.1371/journal.pone.0157700. eCollection 2016. PLoS One. 2016. PMID: 27332705 Free PMC article.
References
-
- Bali M, Akabas MH. Defining the propofol binding site location on the GABAA receptor. Mol Pharmacol. 2004;65:68–76. - PubMed
-
- Baumann SW, Baur R, Sigel E. Forced subunit assembly in alpha1beta2gamma2 GABAA receptors. Insight into the absolute arrangement. J Biol Chem. 2002;277:46020–46025. - PubMed
-
- Boileau AJ, Baur R, Sharkey LM, Sigel E, Czajkowski C. The relative amount of cRNA coding for gamma2 subunits affects stimulation by benzodiazepines in GABA(A) receptors expressed in Xenopus oocytes. Neuropharmacology. 2002;43:695–700. - PubMed
Publication types
MeSH terms
Substances
Grants and funding
LinkOut - more resources
Full Text Sources
Other Literature Sources
