. 2008 Dec 1;112(12):4512-22.
doi: 10.1182/blood-2008-05-157560. Epub 2008 Sep 19.

Endoglin expression in blood and endothelium is differentially regulated by modular assembly of the Ets/Gata hemangioblast code

Affiliations

Endoglin expression in blood and endothelium is differentially regulated by modular assembly of the Ets/Gata hemangioblast code

John E Pimanda et al. Blood. .

Abstract

Endoglin is an accessory receptor for TGF-beta signaling and is required for normal hemangioblast, early hematopoietic, and vascular development. We have previously shown that an upstream enhancer, Eng -8, together with the promoter region, mediates robust endothelial expression yet is inactive in blood. To identify hematopoietic regulatory elements, we used array-based methods to determine chromatin accessibility across the entire locus. Subsequent transgenic analysis of candidate elements showed that an endothelial enhancer at Eng +9 when combined with an element at Eng +7 functions as a strong hemato-endothelial enhancer. Chromatin immunoprecipitation (ChIP)-chip analysis demonstrated specific binding of Ets factors to the promoter as well as to the -8, +7+9 enhancers in both blood and endothelial cells. By contrast Pu.1, an Ets factor specific to the blood lineage, and Gata2 binding was only detected in blood. Gata2 was bound only at +7 and GATA motifs were required for hematopoietic activity. This modular assembly of regulators gives blood and endothelial cells the regulatory freedom to independently fine-tune gene expression and emphasizes the role of regulatory divergence in driving functional divergence.


Figures
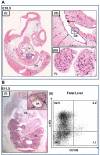
FIGURE 1
FIGURE 1. Endoglin is expressed in blood and endothelium in the developing embryo
(A) In situ hybridization (ISH) for Eng RNA in an E10.5 embryo. (i) Sagittal section of a paraffin embedded whole-mount embryo; Endoglin (black-purple stain) is expressed in the lining of the cardiac chambers (H), DA, FL (boxed) and vasculature of multiple tissues. (ii) Magnified view of the DA showing concentration of Eng RNA in the hemogenic endothelium (arrow) and in blood clusters (boxed). (iii) Magnified view of the FL. (B) Endoglin expression at E11.5. (i) ISH for Eng RNA. Transverse cryosection of an embryo at the level of the AGM shows expression in FL and DA. The inset shows a magnified view of the DA with Eng RNA concentrated in blood clusters (arrows). (ii) Flowcytometry plots showing Eng (CD105) expression in ~3% of FL cells. DA, dorsal aorta; FL, fetal liver; H, heart.
FIGURE 2
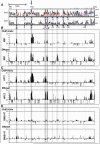
FIGURE 2. Chromatin accessibility profiles across the Eng locus of endothelial and blood progenitor cell lines
(A) Vista plots of sequence alignments of mammalian Eng loci. M, Mus musculus; H, Homo sapiens and O, Monodelphis domestica. Conserved regions are displayed relative to their positions in the mouse genome (horizontal axis). Segments that show over > 66% sequence identity (indicated on the vertical axis) at the nucleotide level over a 100 bp window are highlighted in pink (non-coding regions) or cyan (coding exons). Exons are displayed above the comparison plots in cyan. Eng exon1 is marked with a block arrow. (B-D) Array based histone acetylation state (H3Ac ChIP-chip) and DNaseI hypersensitive site profiles across the Eng loci of MS1 endothelial cells, HPC-7 hematopoietic progenitor cells and BW5147 T-cells. Samples were hybridized in triplicate and fold enrichment over non-enriched input (normalized to the median of values across the Eng locus) is plotted (log2) against genomic position in kilobases. The width of each bar represents the width of each spotted oligonucleotide on the array. The gray longitudinal bars highlight regions of chromatin accessibility that overlap with genomic regions that are highly conserved in mammals. Accessibility at these conserved regions was either consistent (solid bars) or not (dashed bars) between ChIP-chip and DNaseI hypersensitivity. (B) In Endoglin expressing MS1 endothelial cells, significant enrichments (i.e. chromatin accessibility) was noted on both profiles at the Eng promoter (P), the -8kb endothelial enhancer (-8) and also at a 500bp region 9kb downstream of the promoter (+9). (C) In Endoglin expressing HPC-7 cells chromatin accessibility was noted on both profiles at the Eng promoter (P) and also at the -8, +7 (~ 500bp region 7kb downstream of the promoter) and +9 regions. (D) In Endoglin non-expressing BW 5147 cells the Eng promoter (P) was not accessible.
FIGURE 3
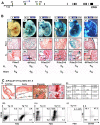
FIGURE 3. The Eng+7 and Eng+9 regions target blood progenitors in developing embryos
(A) Schematic diagram of the human ENG locus. The exons and enhancer fragments are drawn to scale and are represented as black and green rectangles respectively. (B) F0 transgenic embryos generated using various ENG fragments sub-cloned into ENG (P) promoter lacZ constructs. (i) - (vi) representative X-Gal stained whole-mount E11.5 embryos. (vii) - (xii) Sections through the hearts of corresponding embryos; (vii) shows no endocardial staining; (viii) - (xii) show variable degrees of endocardial staining. (xiii) - (xviii) Sections through the livers of corresponding embryos; (xiii) shows no staining in FL cells; (xiv) shows staining of flat endothelial cells (block arrow); (xv)- (xviii) show staining of round hematopoietic cells (arrows). A table summarizing the number of X-Gal stained F0 transgenic embryos that showed staining in the heart and/ or liver out of the number of transgenic embryos generated with each construct is also shown. (C) Analyses of E11.5 embryos from a litter of -8/P/lacZ/+7/+9 (L1091) x WT crosses. (i) Tissue sections from X-Gal stained embryos showing reporter activity in yolk sac and dorsal aorta endothelium and blood cells in the placenta and fetal liver. (ii) A table summarizing results from in vitro colony-forming assays using sorted cell fractions from FDG treated E11.5 FLs. (iii)- (v) Flowcytometry of FDG treated non-transgenic and transgenic E11.5 FLs from a litter of -8/P/lacZ/+7/+9 (L1091) x WT crosses. The transgene targets 3- 4% of FL cells; the majority of which are (iii) Endoglin positive, (iv) c-Kit positive, (v) Endoglin and c-Kit dual positive. BFU-E, burst-forming unit-erythroid; CFU-G, colony-forming unit-granulocyte; CFU-GEMM, colony-forming unit granulocyte/ erythroid/ macrophage/ megakaryocyte).
FIGURE 4
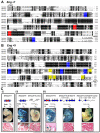
FIGURE 4. Activity of the Eng+7 and Eng+9 enhancers require conserved Ets and/or Gata TF binding sites
(A) Nucleotide sequence alignment of the Eng+7 enhancer with conserved Ets binding sites marked in blue and Gata binding sites in red. The nucleotide numbering is relative to the first ATG. (B) Nucleotide sequence alignment of the Eng+9 enhancer with Ets binding sites conserved in human/mouse/opossum marked in blue and human/mouse but not opossum in yellow. (C) Representative X-Gal stained whole-mount E11.5 F0 transgenic embryos generated with various wild-type or mutant Eng+7 and/or Eng+9 fragments subcloned into a SV40 promoter/lacZ reporter (SV/lacZ). Fully conserved Ets (E) and Gata (G) binding sites are represented as circles. The number of transgenic embryos with endothelial and/or fetal liver staining relative to number generated is also shown. The degree of X-gal staining is indicated as weak (+) - strong (++++). (i) SV/lacZ/+7 embryos show minimal blood/endothelial staining. (ii) SV/lacZ/+9 embryos show strong endothelial but little blood staining. SV/lacZ/+9 (ΔEts) (missing region with fully conserved Ets binding sites in Eng+9) embryos show variable endothelial staining (some embryos show none) but no fetal liver staining. (iii) SV/lacZ/+7/+9 embryos show strong blood and endothelial staining. SV/lacZ7 (ΔG1G2)/+9 (missing region with conserved Gata binding sites in Eng+7) embryos show variable endothelial and no blood staining. SV/lacZ/+7(ΔG1G2)/+9 (ΔEts) (missing region with conserved Gata sites in Eng+7 and fully conserved Ets sites in Eng+9) embryos show variable endothelial and no blood staining.
FIGURE 5
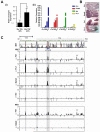
FIGURE 5. Fli1, Pu.1 and Gata2 bind the Endoglin hematopoietic enhancers in vivo
(A) Variation in gene expression during in vitro differentiation of GFP-Bry ES cells to embryoid bodies. (i) Levels of Endoglin expression in hemangioblast containing DP (Bry +/Flk+) cells relative to pre-hemangioblast SP (Bry+/Flk-) cells. (ii) TF levels in ES cells, cell fractions sorted from day 3.5 (DN, SP and DP) and unsorted day 4.5 EBs. (B) In situ hybridization for Fli1, Gata2, Scl and Pu.1 transcripts in fetal livers of E11.5 mouse embryos. (C) ChIP- chip profiles of TF binding across the Eng locus of HPC-7 hematopoietic progenitor cells. Vista plots of sequence alignments of mouse and human Eng loci are shown in the upper panel with ChIP-chip profiles shown below. The grey bars indicate the genomic positions of the conserved -8, P, +7 and +9 segments. ChIP assays were performed in HPC-7 hematopoietic progenitor cells with anti-Fli1, -Pu.1, -Gata2 and -Scl antibodies and MS1 endothelial cells with anti-Fli1 and Gata2 antibodies. Samples were hybridized in triplicate and fold enrichment over non-enriched input (normalized to the median of values across the Eng locus) is plotted (log2) against genomic position in kilobases. The width of each bar represents the width of each spotted oligonucleotide on the array. The HPC-7 plots show enrichment of Fli1 and Pu.1 at the Eng promoter and the Eng -8, Eng+7 and Eng+9 enhancers, enrichment of Gata2 at the Eng+7 enhancer but no enrichment of Scl at the Eng locus. The enrichment profile of Fli1 in MS1 cells is similar to that of HPC-7 cells but Gata2 is not enriched at the Eng locus in endothelial cells. EB, Embryoid Body; DN, Double Negative; SP, Single Positive; DP, Double Positive.

Similar articles

Cited by

References

    1. Cantor AB, Orkin SH. Transcriptional regulation of erythropoiesis: an affair involving multiple partners. Oncogene. 2002;21:3368–3376. - PubMed
    1. Gottgens B, Nastos A, Kinston S, et al. Establishing the transcriptional programme for blood: the SCL stem cell enhancer is regulated by a multiprotein complex containing Ets and GATA factors. Embo J. 2002;21:3039–3050. - PMC - PubMed
    1. Donaldson IJ, Chapman M, Kinston S, et al. Genome-wide identification of cis-regulatory sequences controlling blood and endothelial development. Hum Mol Genet. 2005;14:595–601. - PubMed
    1. Pimanda JE, Donaldson IJ, de Bruijn MF, et al. The SCL transcriptional network and BMP signaling pathway interact to regulate RUNX1 activity. Proc Natl Acad Sci U S A. 2007;104:840–845. - PMC - PubMed
    1. Pimanda JE, Ottersbach K, Knezevic K, et al. Gata2, Fli1, and Scl form a recursively wired gene-regulatory circuit during early hematopoietic development. Proc Natl Acad Sci U S A. 2007;104:17692–17697. - PMC - PubMed

Publication types

MeSH terms