. 2008 Dec 15;112(13):5063-73.
doi: 10.1182/blood-2007-10-120832. Epub 2008 Sep 19.

NF-kappaB1 and c-Rel cooperate to promote the survival of TLR4-activated B cells by neutralizing Bim via distinct mechanisms

Affiliations

NF-kappaB1 and c-Rel cooperate to promote the survival of TLR4-activated B cells by neutralizing Bim via distinct mechanisms

Ashish Banerjee et al. Blood. .

Abstract

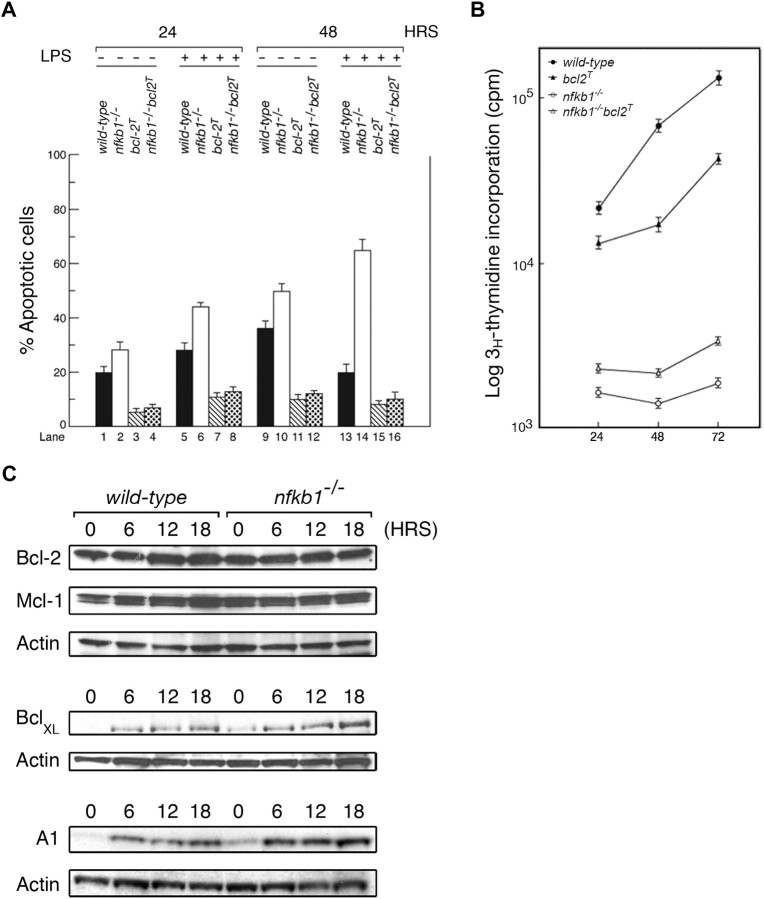
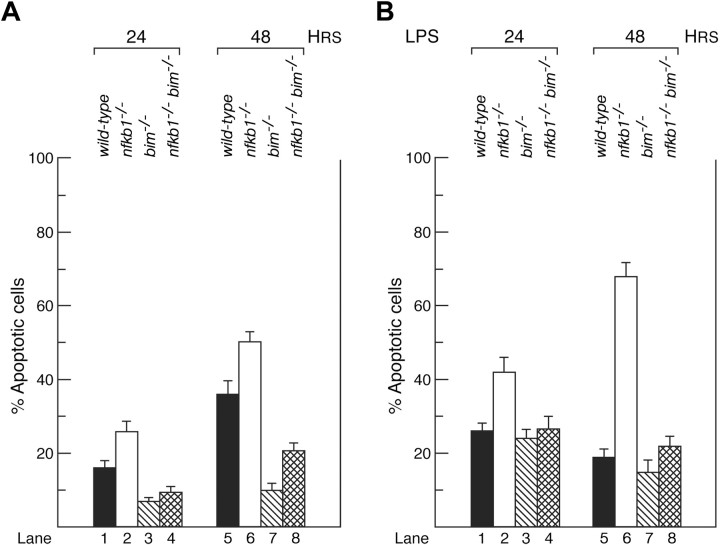
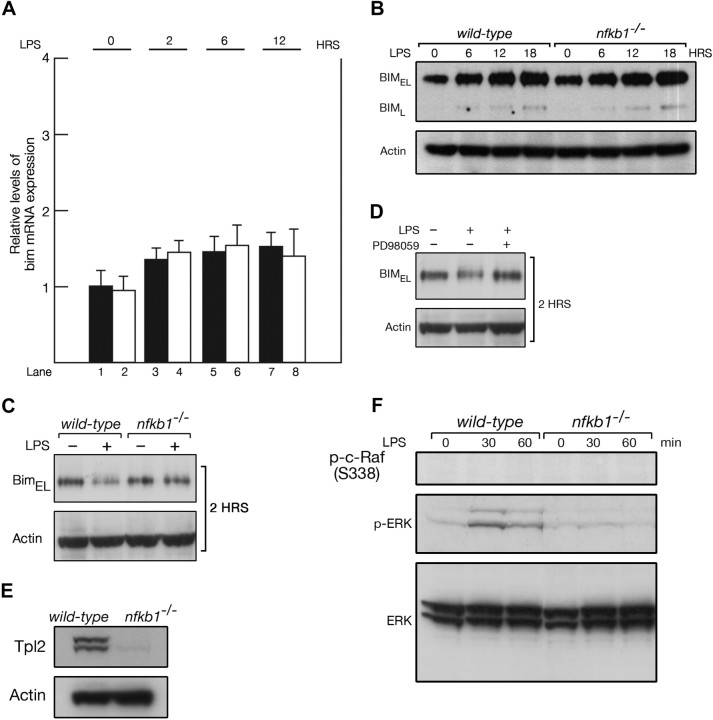
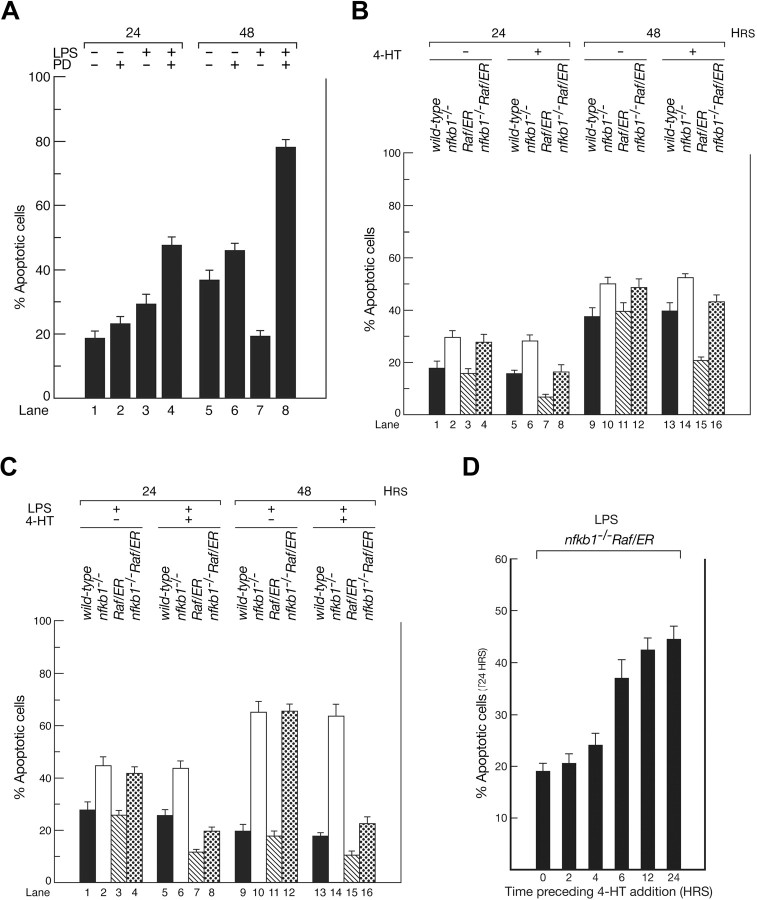
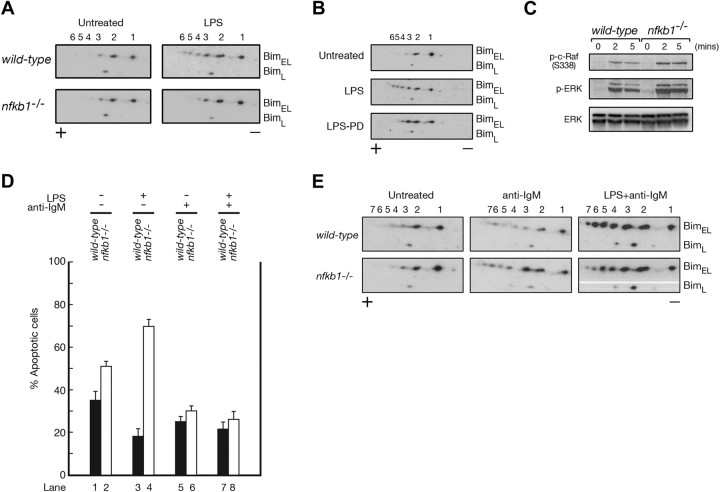
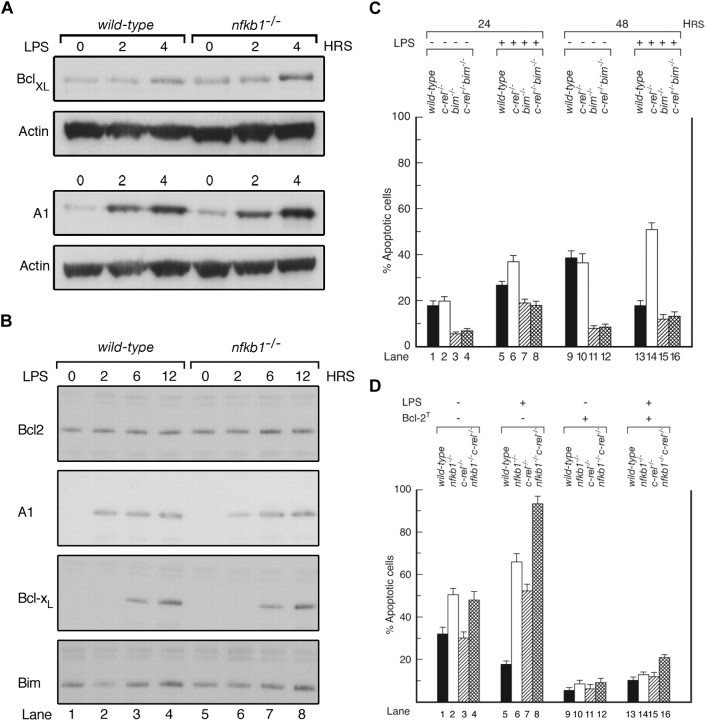
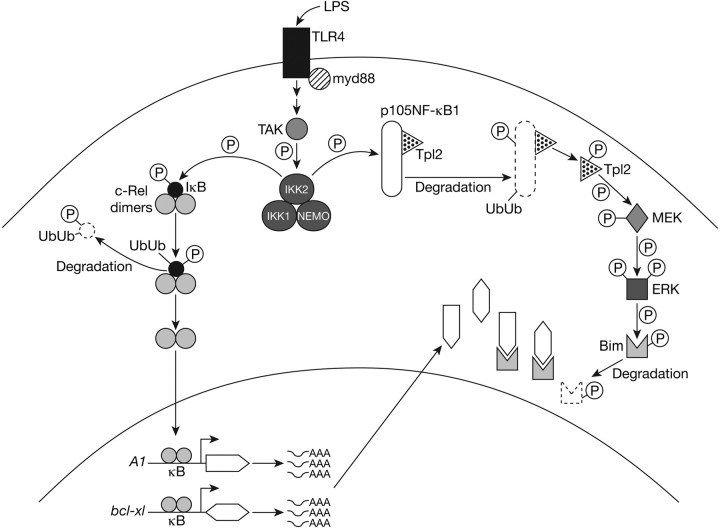
The nuclear factor-kappaB (NF-kappaB) pathway is crucial for the survival of B cells stimulated through Toll-like receptors (TLRs). Here, we show that the heightened death of TLR4-activated nfkb1(-/-) B cells is the result of a failure of the Tpl(2)/MEK/ERK pathway to phosphorylate the proapo-ptotic BH3-only protein Bim and target it for degradation. ERK inactivation of Bim after TLR4 stimulation is accompanied by an increase in A1/Bim and Bcl-x(L)/Bim complexes that we propose represents a c-Rel-dependent mechanism for neutralizing Bim. Together these findings establish that optimal survival of TLR4-activated B cells depends on the NF-kappaB pathway neutralizing Bim through a combination of Bcl-2 prosurvival protein induction and Tpl2/ERK-dependent Bim phosphorylation and degradation.


Figures

Figure 1
Figure 1
Transgenic Bcl-2 protects nfkb1−/− B cells from spontaneous and LPS-induced apoptosis. Purified B cells from wt, nfkb1−/−, bcl-2T, and nfkb1−/−bcl-2T mice were cultured with or without LPS for the indicated times. (A) Levels of cell death. The data are mean plus or minus SEM for 3 experiments. (B) B-cell proliferation. Results represent mean plus or minus SEM of 3 experiments, each performed in triplicate. (C) Bcl-2, Mcl-1, Bcl-xL, and A1 expression in B cells after LPS stimulation. This blot is representative of 3 experiments.
Figure 2
Figure 2
Loss of Bim prevents spontaneous and LPS-induced nfkb1−/− B-cell apoptosis. wt, nfkb1−/−, bim−/−, and nfkb1−/−bim−/− B cells were cultured with or without LPS for 48 hours. (A) Spontaneous apoptosis after 24 and 48 hours. (B) B-cell death after LPS stimulation over 48 hours. Results represent the mean plus or minus SEM of 5 experiments.
Figure 3
Figure 3
Enhanced LPS-induced apoptosis of nfkb1−/− B cells is associated with defective ERK activation. (A) bim mRNA expression in wt (■) and nfkb1−/− (□) B cells before and after LPS stimulation. bim expression in each sample determined by QRT-PCR was normalized relative to gapdh mRNA expression. The data represent the mean plus or minus SD of 3 experiments. (B) Western blots for Bim in wt and nfkb1−/− B cells after LPS stimulation for 6, 12, and 18 hours. The data are representative of 4 experiments. (C) Bim Western blots for wt and nfkb1−/− B cells left untreated or stimulated with LPS for 2 hours. (D) Bim Western blots for wt B cells, untreated or LPS-stimulated (2 hours) in the absence or presence of PD98059. (E) Tpl2 expression in wt and nfkb1−/− B cells. (F) ERK and c-Raf S338 phosphorylation in wt and nfkb1−/− B cells after LPS stimulation. Results shown for panels C through F are representative of 3 separate experiments.
Figure 4
Figure 4
ERK activation protects LPS-activated B cells from apoptosis. (A) wt B cells (> 99% viable at T0) were untreated or stimulated for 24 and 48 hours with LPS in the absence or presence of PD98059. The frequency of apoptotic cells was determined at each time point. The data represent the mean plus or minus SEM from 4 experiments. (B,C) wt or nfkb1−/− B cells transduced with control or Raf/ER-expressing retroviruses left untreated or stimulated for 48 hours with LPS in the absence or presence of 4-HT. Apoptosis was assessed at 24 and 48 hours. (B) Levels of spontaneous apoptosis. (C) Levels of LPS-induced apoptosis. Both sets of data represent the mean plus or minus SD from 4 separate experiments. (D) Apoptosis in cultures of LPS-treated nfkb1−/− B cells expressing Raf/ER activated with 4-HT 0, 2, 4, 6, 12, or 24 hours after initiating TLR4 signaling. Results are the mean plus or minus SD from 3 experiments.
Figure 5
Figure 5
LPS stimulation results in ERK phosphorylation of Bim. (A,B) wt or nfkb1−/− B cells were cultured for 2 hours without or with LPS in the absence or presence of PD98059. Cell lysates were subjected to 2-dimensional gel electrophoresis and Western blotting using Bim-specific antibodies. The data are representative of 5 experiments. (C) Western blots for phospho–c-Raf, phospho-ERK, and ERK in wt and nfkb1−/− B cells stimulated with anti-IgM antibodies. Data are representative of 3 experiments. (D) Apoptosis in wt and nfkb1−/− B-cell cultures untreated or stimulated for 48 hours with LPS, anti-IgM antibodies, or both agents. The data represent the mean plus or minus SEM from 4 experiments. (E) Bim Western blots on 2-dimensional gels for wt and nfkb1−/− B cells left untreated or stimulated (2 hours) with anti-IgM antibodies in the absence or presence of LPS. Data are representative of 3 experiments. The symbols “+” and “−” (panels A, B, and C) refer to the anode and cathode, respectively, and numbers refer to Bim isoforms.
Figure 6
Figure 6
LPS stimulation increases the association of Bim with A1 and Bcl-xL in B cells. (A) Western blots for Bcl-xL and A1 from wt and nfkb1−/− B cells stimulated with LPS for the indicated times. The data are representative of 3 experiments. (B) Bim immune precipitates from lysates of untreated or LPS-stimulated (2, 6, and 12 hours) wt and nfkb1−/− B cells analyzed by Western blotting for Bcl-2, A1, and Bcl-xL expression. (C) Spontaneous and LPS-induced apoptosis in B cells from wt, c-rel−/−, bim−/−, or c-rel−/−bim−/− mice. The data represent the mean plus or minus SEM from 4 experiments. (D) Spontaneous and LPS-induced apoptosis of B cells from wt, nfkb1−/−, c-rel−/−, or nfkb1−/−c-rel−/− (all with or without the bcl-2T). The data represent the mean plus or minus SEM from 3 experiments.
Figure 7
Figure 7
Optimal B-cell survival in response to TLR4 signaling. Optimal B-cell survival in response to TLR4 signaling involves Bim neutralization by a combination of degradation after Tpl2-dependent ERK phosphorylation, plus binding to the Bcl-2–like prosurvival proteins A1 and Bcl-xL, which are up-regulated by c-Rel–dependent transcription.

References

    1. Kawai T, Akira S. TLR signaling. Cell Death Differ. 2006;13:816–825. - PubMed
    1. Mond JJ, Vos Q, Lees A, Snapper CM. T cell independent antigens. Curr Opin Immunol. 1995;7:349–354. - PubMed
    1. Hayden MS, Ghosh S. Signaling to NF-kappaB. Genes Dev. 2004;18:2195–2224. - PubMed
    1. Karin M, Ben-Neriah Y. Phosphorylation meets ubiquitination: the control of NF-[kappa]B activity. Annu Rev Immunol. 2000;18:621–663. - PubMed
    1. Grumont RJ, Gerondakis S. The subunit composition of NF-kappa B complexes changes during B-cell development. Cell Growth Differ. 1994;5:1321–1331. - PubMed

Publication types