. 2008 Oct 1;22(19):2677-91.
doi: 10.1101/gad.1695308. Epub 2008 Sep 19.

TAp73 knockout shows genomic instability with infertility and tumor suppressor functions

Affiliations

TAp73 knockout shows genomic instability with infertility and tumor suppressor functions

Richard Tomasini et al. Genes Dev. .

Abstract

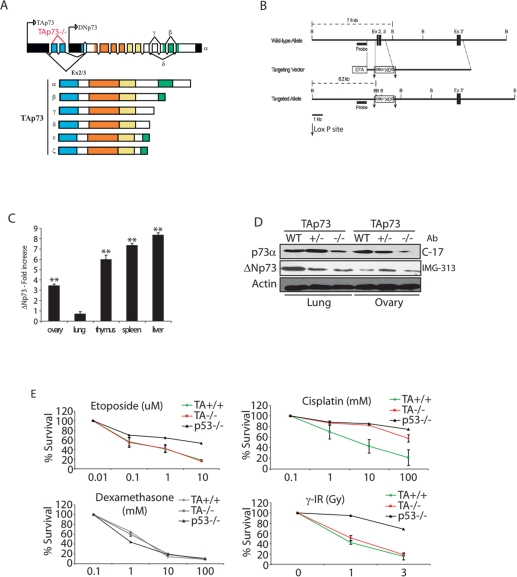
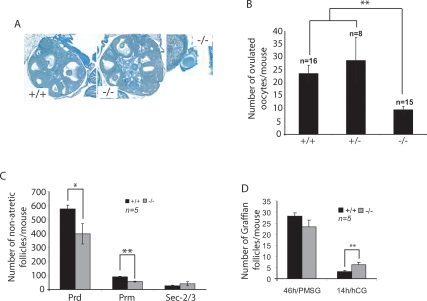
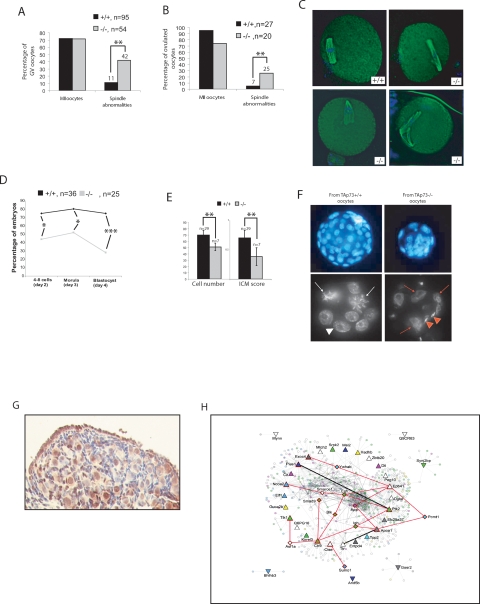
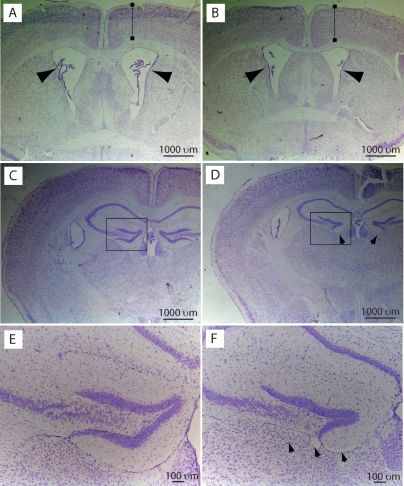
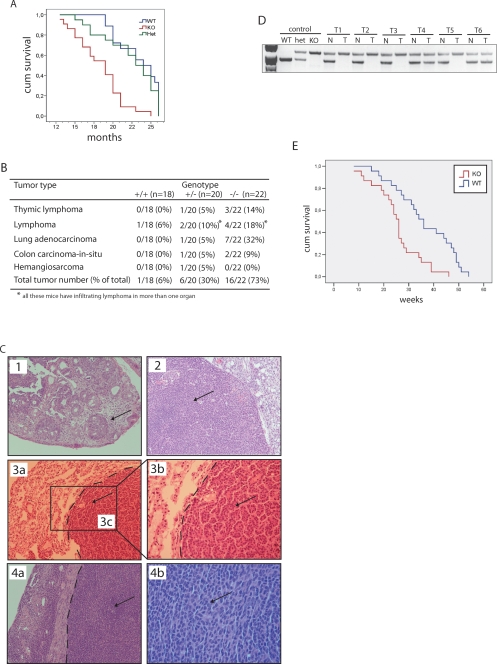
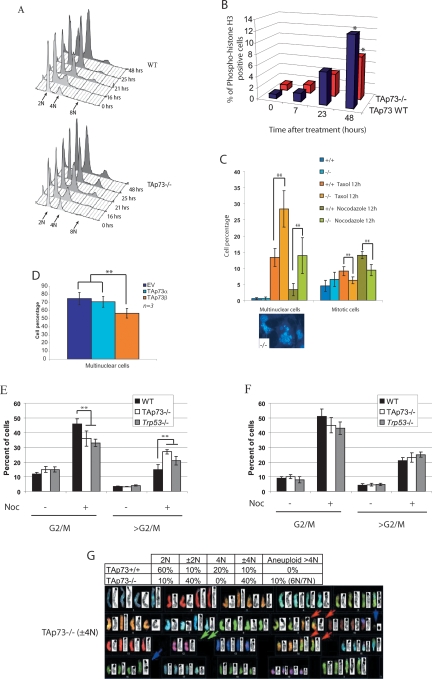
The Trp53 gene family member Trp73 encodes two major groups of protein isoforms, TAp73 and DeltaNp73, with opposing pro- and anti-apoptotic functions; consequently, their relative ratio regulates cell fate. However, the precise roles of p73 isoforms in cellular events such as tumor initiation, embryonic development, and cell death remain unclear. To determine which aspects of p73 function are attributable to the TAp73 isoforms, we generated and characterized mice in which exons encoding the TAp73 isoforms were specifically deleted to create a TAp73-deficient (TAp73(-/-)) mouse. Here we show that mice specifically lacking in TAp73 isoforms develop a phenotype intermediate between the phenotypes of Trp73(-/-) and Trp53(-/-) mice with respect to incidence of spontaneous and carcinogen-induced tumors, infertility, and aging, as well as hippocampal dysgenesis. In addition, cells from TAp73(-/-) mice exhibit genomic instability associated with enhanced aneuploidy, which may account for the increased incidence of spontaneous tumors observed in these mutants. Hence, TAp73 isoforms exert tumor-suppressive functions and indicate an emerging role for Trp73 in the maintenance of genomic stability.


Figures

Figure 1.
Figure 1.
Generation of TAp73−/− mice and up-regulation of ΔNp73 expression. (A) Structure of the murine Trp73 gene showing the TAp73 and ΔNp73 isoform families. Domains: (blue) transactivation; (orange) DNA binding; (yellow) oligomerization; (green) sterile α motif. (B) Targeting strategy. Homologous recombination of the indicated targeting vector with the wild-type Trp73 gene resulted in the replacement of ∼1.5 kb with the neo gene and the deletion of exons 2 and 3 specific to the TAp73 isoform. LoxP sites and the probe used for Southern blotting are indicated. (C) Quantitation of ΔNp73 expression in tissues from TAp73+/+ and TAp73−/− mice. Fold increase of ΔNp73 mRNA level in TAp73−/− tissues compared with wild-type tissues by real-time PCR. (**) P < 0.01 (Student’s t-test). (D) Western blot analysis of ΔNp73 level in lung and ovary from 10-mo-old wild-type and TAp73-deficient mice. C-17 antibody is specific from α-C-terminal isoforms, and IMG-313 antibody is specific from ΔNp73 isoforms. (Ab) Antibody. (E) Thymocyte death. Thymocytes from TAp73+/+, TAp73−/−, and p53−/− mice were treated for 24 h with the indicated agents at the indicated concentrations, and percent cell death was assayed by annexinV staining and flow cytometry. Data represent the mean ± SD of two experiments.
Figure 2.
Figure 2.
Characterization of reproductive defects in TAp73−/− female mice. (A) Normal TAp73−/− ovarian structure. (Left and center panels) Sections of ovaries from 4-wk-old TAp73+/+ and TAp73−/− mice stained with picric acid and methyl blue. Magnification, 5 × 10. (Right panel) While no obvious differences in gross ovarian morphology were detected, ovulated oocytes were trapped under the bursa in TAp73−/− ovary. Magnification, 40 × 10. (B) TAp73-deficient females ovulate fewer oocytes. Immature TAp73+/+, TAp73+/−, and TAp73−/− females were superovulated, and the number of oocytes per mouse was counted. The results shown are the mean ovulated oocyte number ± SE for the indicated number (n) of mice/genotype. (**) P < 0.001 (Student’s t-test). (C) Ovarian reserve is diminished by TAp73 deficiency. Serial sections of ovaries from superovulated immature TAp73+/+ and TAp73−/− mice were subjected to histomorphometric analysis. The results shown are the mean number of nonatretic follicles/mouse ± SE for 5 mice per group. (*) P < 0.01; (**) P < 0.001 (Student’s t-test). The number of both primordial (Prd) and primary (Prm) follicles is significantly decreased, but the growth rate evidenced by the number of secondary follicles with two to three layers of granulosa cells (Sec-2/3) is not altered. (D) The decreased number of ovulated oocytes is caused by impaired ovulation and not by insufficient follicular growth. The number of Graffian follicles with oocytes before (46 h/PMSG) and the number of luteinized follicles with oocytes after ovulation (14h/HCG) was determined in 3-wk-old TAp73+/+ and TAp73−/− female mice. The results shown are the mean number of Graffian follicles/mouse ± SE for n = 5 mice per group. (**) P < 0.001 (Student’s t-test).
Figure 3.
Figure 3.
TAp73 deficiency effects on oocyte quality. (A,B) Quantitation of spindle abnormalities in TAp73+/+ and TAp73−/− oocytes matured in vitro (A) or in vivo (B). While no difference was observed in ability to proceed through the meiosis and arrest in metaphase II (MII), higher numbers of spindle abnormalities were detected in TAp73 oocytes. (**) P < 0.001 (Student’s t-test). (C) Representative examples of B. Magnification, 40 × 10. (D) The IVF procedure showed that no difference exists in the fertilization rate caused by TAp73 deficiency, but progression of zygotes through preimplantation development is abnormal. The percentage of TAp73−/− oocytes that upon fertilization reached the four- to eight-cell, morula, and blastocyst stages at appropriate developmental days is greatly diminished. (*) P < 0.01; (***) P < 0.0001. Statistical analyses were done using an X2 test. (E) Poor quality of IVF-derived blastocysts obtained from TAp73−/− oocytes as assessed by total cell number (left) and inner cell mass (ICM) score (right). (**) P < 0.001 (Student’s t-test). (F) DAPI staining of blastocysts (top, magnification, 20 × 10) and eight-cell stage-arrested embryos (bottom, magnification, 40 × 10) of B. (White arrows) Mitotic cells; (white arrowhead) normal nucleus; (red arrows) multinuclear cells; (red arrowheads) sperm heads. (G) TAp73 expression in a post-natal day 4 TAp73+/+ ovary as detected by immunohistochemical staining with H79 antibody. (H) Network visualization of genes that were up-regulated in TAp73+/+ and TAp73−/− neonatal ovaries. Node color represents GO (The Gene Ontology) function, as shown in the legend. Node shape represents different targets: Triangles pointed up are targets up-regulated in TAp73−/− ovary; triangles pointing down are targets up-regulated in TAp73+/+ ovary. Diamonds and triangles outlined in red represent critical proteins within the network. Thicker lines indicate direct interactions among targets. Red lines represent critical interactions within the network. All other lines represent secondary interacting proteins.
Figure 4.
Figure 4.
TAp73 is essential for normal hippocampal development. Representative pictures from multiple experiments using seven TAp73+/+ and seven TAp73−/− mice of coronal forebrain sections of 4-mo-old TAp73+/+ (A,C,E) and TAp73−/− (B,D,F) C57B6 background mice stained with cresyl violet. (A,B) Nissl-stained coronal sections of forebrain at the level of the anterior commissure. Arrows indicate the lateral ventricles. Cortical thickness (brackets) was similar in TAp73+/+ and TAp73−/− brains. (C–F) Nissl-stained coronal sections of the forebrain at the level of the rostral hippocampus. The area denoted by the boxes in C and D is shown at higher magnification in E and F, respectively. Arrows in D and F denote the site of the lower blade of the dentate gyrus, which is missing in the TAp73−/− brain.
Figure 5.
Figure 5.
TAp73−/− mice are tumor-prone and sensitive to carcinogens. (A) Kaplan-Meyer survival curves of TAp73+/+ (n = 18), TAp73+/− (n = 20), and TAp73−/− (n = 22) mice. P < 0.001 (Logrank test). (B) Spontaneous tumor spectrum in TAp73+/+, TAp73+/−, and TAp73−/− mice. Spontaneous tumor development in TAp73−/− mice is significative with a P-value of P < 0.005 (X2 Test). (C, arrows) H&E-stained tumors in tissues of TAp73−/− mice. (1) Colon carcinoma in situ, 10× magnification. (2) Invasive lymphoma in ovary, 10× magnification. (3a–3c) Lung adenocarcinoma, 10× magnification, with 3b being a higher magnification of 3c, 20× magnification. (4a–4b) Invasive lymphoma in uterus, 10× magnification, with 4b being a higher magnification of 4a, 40× magnification. Dotted lines denote the border between healthy and tumoral tissue. (D) Representative LOH analysis of six TAp73+/− tumor-bearing mice (T1-6); (T) tumor; (N) normal tissue. (E) Kaplan-Meyer survival curves of DMBA-treated TAp73+/+ (n = 23) and TAp73−/− (n = 23) mice in weeks after treatment. P < 0.005 (Logrank test).
Figure 6.
Figure 6.
Defective maintenance of genomic stability in the absence of TAp73. (A) Cell cycle analysis by flow cytometry of TAp73+/+ (top) and TAp73−/− (bottom) MEFs treated with nocodazole for the indicated number of hours. The graph was created using FlowJo 7.2.2 software. (B) Percentage of phospho-histone H3+ cells in cultures of TAp73+/+ (TAp73 wild type) and TAp73−/− MEFs treated with nocodazole for indicated times. (*) P < 0.01 (Student’s t-test). (C) Percentages of multinuclear (left) and mitotic (right) cells in TAp73+/+ and TAp73−/− MEFs treated with taxol or nocodazole as indicated. (Bottom) DAPI-stained multinuclear TAp73−/− MEFs; 40× magnification. The data shown represent the mean ± SE of three different experiments. (**) P < 0.001 (Student’s t-test). (D) Percentage of multinuclear cells in H1299 cultures overexpressing empty vector (EV) or vector containing the indicated TAp73 isoforms and treated with taxol for 24 h. (**) P < 0.001 (Student’s t-test). (E,F) Percentages of cells in G2/M phase or in >G2/M phase (aneuploid cells). Cells were extracted from the lung (E) or thymus (F) of wild-type, TAp73−/−, and Trp53−/− mice and treated for 12 h with nocodazole. The results shown are the mean percentage of cells ± SE of three independent trials. (**) P < 0.001 (Student’s t-test). (G) Increased aneuploidy. (Top) Percentages of cells in TAp73+/+ and TAp73−/− 3T3 cultures showing diploid (2N), near-diploid (±2N), tetraploid (4N), near-tetraploid (±4N), and aneuploid (>4N) DNA content. (Bottom) Representative karyotype of a ±4N TAp73−/− 3T3 cell.

Comment in

Similar articles

Cited by

References

    1. Acton B.M., Jurisicova A., Jurisica I., Casper R.F. Alterations in mitochondrial membrane potential during preimplantation stages of mouse and human embryo development. Mol. Hum. Reprod. 2004;10:23–32. - PubMed
    1. Akanuma T., Koshida S., Kawamura A., Kishimoto Y., Takada S. Paf1 complex homologues are required for Notch-regulated transcription during somite segmentation. EMBO Rep. 2007;8:858–863. - PMC - PubMed
    1. Baird D.T., Collins J., Egozcue J., Evers L.H., Gianaroli L., Leridon H., Sunde A., Templeton A., Van Steirteghem A., Cohen J., et al. Fertility and ageing. Hum. Reprod. Update. 2005;11:261–276. - PubMed
    1. Bolstad B.M., Irizarry R.A., Astrand M., Speed T.P. A comparison of normalization methods for high density oligonucleotide array data based on bias and variance. Bioinformatics. 2003;19:185–193. - PubMed
    1. Bourdon J.C., Fernandez K., Murray-Zmijewski K., Liu G., Diot A., Xirodimas D.P., Saville M.K., Lane D.P. p53 isoforms can regulate p53 transcriptional activity. Genes & Dev. 2005;19:2122–2137. - PMC - PubMed

Publication types

MeSH terms