. 2008 Oct 1;22(19):2621-6.
doi: 10.1101/gad.1688508. Epub 2008 Sep 19.

Genomic predictors of interindividual differences in response to DNA damaging agents

Affiliations

Genomic predictors of interindividual differences in response to DNA damaging agents

Rebecca C Fry et al. Genes Dev. .

Abstract

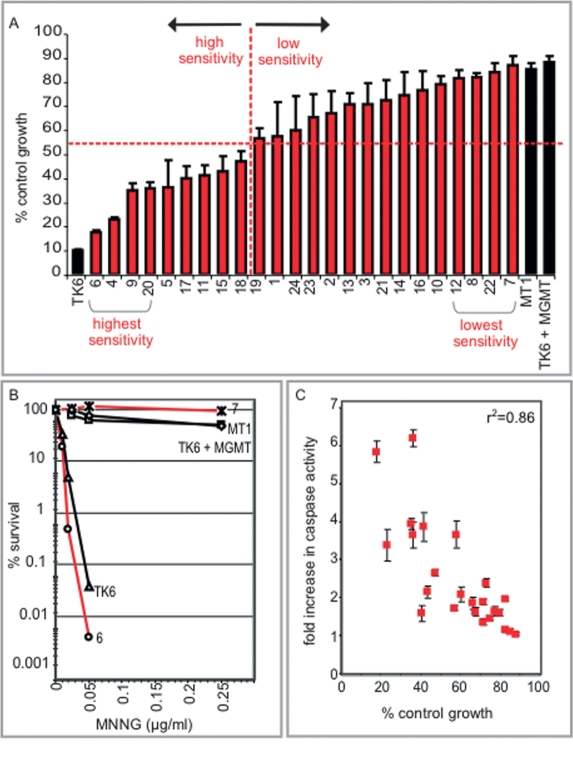
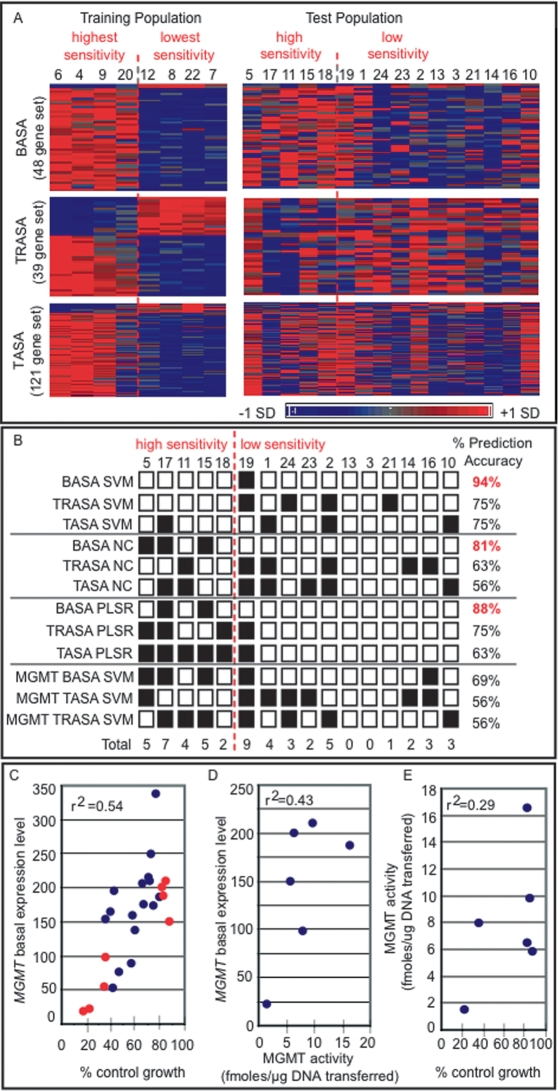
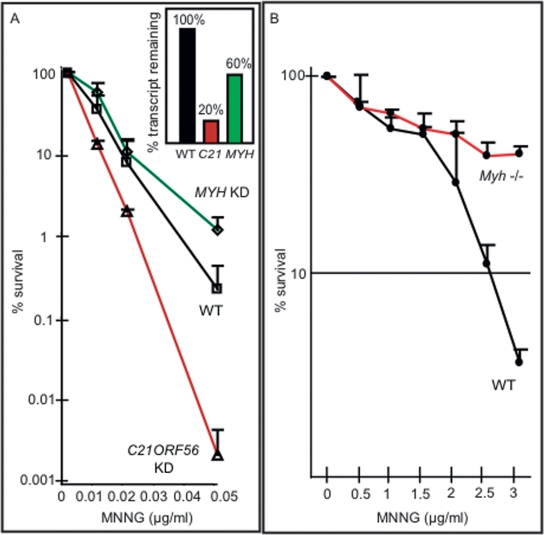
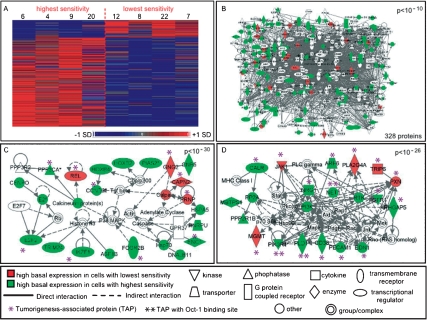
Human lymphoblastoid cells derived from different healthy individuals display considerable variation in their transcription profiles. Here we show that such variation in gene expression underlies interindividual susceptibility to DNA damaging agents. The results demonstrate the massive differences in sensitivity across a diverse cell line panel exposed to an alkylating agent. Computational models identified 48 genes with basal expression that predicts susceptibility with 94% accuracy. Modulating transcript levels for two member genes, MYH and C21ORF56, confirmed that their expression does indeed influence alkylation sensitivity. Many proteins encoded by these genes are interconnected in cellular networks related to human cancer and tumorigenesis.


Figures

Figure 1.
Figure 1.
A considerable range of interindividual sensitivity to a DNA alkylating agent. (A) The percentage of control growth of the cell lines at 72 h after treatment with MNNG (0.5 μg/mL) using a growth inhibition assay. The division between high and low sensitivity among the cell lines is demarcated at 53% with a red dotted line. (B) The percentage of survival of cell lines 6 and 7 was determined 10 d after treatment with MNNG and compared with three control cell lines (TK6, TK6 + MGMT, and MT1) using a killing curve assay. (C) Fold increase in caspase-3 activity was determined 72 h post-treatment with MNNG across the cell line panel.
Figure 2.
Figure 2.
Identification of ASA genes that predict interindividual differences in alkylation sensitivity. (A) Three ASA gene sets were identified from a training population comprising the four most sensitive and the four least sensitive cell lines including (1) 48 genes derived from basal gene expression (the BASA set), (2) 39 genes derived from treatment-to-basal expression ratio (the TRASA set), and (3) 121 genes derived from treatment-induced expression (the TASA set). Expression patterns for the gene sets are shown for both the training and the test populations of cell lines. Expression values are mean centered with high relative expression indicated in red and low relative expression indicated in blue. (B) The sensitivity of the test population of cell lines to MNNG was predicted using three algorithms: SVM, NC, and PLSR. The two-class prediction algorithms were used with each of the three ASA gene sets as well as the MGMT transcript alone. Correct prediction is indicated with a white box; incorrect prediction, with a black box. (C) MGMT expression level is plotted versus the percentage of control growth of the cell lines treated with MNNG. Red circles indicate cell lines of the training population, and blue circles indicate cell lines of the test population. (D) O6-MeG DNA methyltransferase activity was determined in protein extracts derived from cell lines 4, 7, 20, 12, 22, and 8. Methyltransferase activity is plotted versus the baseline expression level of MGMT in each cell line. (E) Methyltransferase activity is plotted versus the percentage of control growth for the same cell lines as in (D).
Figure 3.
Figure 3.
Modulation of C21ORF56, MYH, and Myh influences MNNG sensitivity. (A) TK6 cells expressing a control shRNA (WT) or shRNA specifically targeting the C21ORF56 transcript (v1), or the MYH transcript (v1), were assessed for the percentage of survival after exposure to MNNG. The inset shows the percentage of transcript remaining C21ORF56 and MYH in knockdown cells. (B) Percentage of survival of Myh−/− or wild-type MEFs determined after treatment with MNNG.
Figure 4.
Figure 4.
Basal expression networks associated with interindividual differences in sensitivity to MNNG. (A) A heat map of the 240 basally differentially expressed genes identified between two classes of the training population, those with highest and lowest MNNG sensitivity. Expression values are mean centered with high relative expression indicated in red and low relative expression indicated in blue. (B) Of the 240 genes from A, 148 were present in the Ingenuity database. These 148 proteins were analyzed for significant enrichment of molecular interactions. A significant (P < 10−10) interactome of 328 total proteins containing 125 of the 148 proteins was identified. (C) The most significant subnetwork (P < 10−30) of ASA proteins. (D) The second most significant subnetwork (P < 10−26) of ASA proteins. Proteins in red are encoded by transcripts with high basal expression in cells with low MNNG sensitivity, and proteins in green are encoded by transcripts with high basal expression in cells with high MNNG sensitivity; proteins in white are associated with these ASA proteins. Tumorigenesis-associated proteins (TAPs) are indicated with an asterisk and TAP proteins containing Oct-1-binding sites are indicated with two asterisks.

References

    1. Begley T.J., Rosenbach A.S., Ideker T., Samson L.D. Hot spots for modulating toxicity identified by genomic phenotyping and localization mapping. Mol. Cell. 2004;16:117–125. - PubMed
    1. Ceccotti S., Aquilina G., Macpherson P., Yamada M., Karran P., Bignami M. Processing of O6-methylguanine by mismatch correction in human cell extracts. Curr. Biol. 1996;6:1528–1531. - PubMed
    1. Cheung V.G., Conlin L.K., Weber T.M., Arcaro M., Jen K.Y., Morley M., Spielman R.S. Natural variation in human gene expression assessed in lymphoblastoid cells. Nat. Genet. 2003;33:422–425. - PubMed
    1. Cheung V.G., Spielman R.S., Ewens K.G., Weber T.M., Morley M., Burdick J.T. Mapping determinants of human gene expression by regional and genome-wide association. Nature. 2005;437:1365–1369. - PMC - PubMed
    1. Collins F.S., Brooks L.D., Chakravarti A. A DNA polymorphism discovery resource for research on human genetic variation. Genome Res. 1998;8:1229–1231. - PubMed

Publication types

MeSH terms