Meta-Analysis
. 2008 Oct;118(10):1793-800.
doi: 10.1097/MLG.0b013e31817d01cd.

Dependence of hearing changes on the dose of intratympanically applied gentamicin: a meta-analysis using mathematical simulations of clinical drug delivery protocols

Affiliations
Meta-Analysis

Dependence of hearing changes on the dose of intratympanically applied gentamicin: a meta-analysis using mathematical simulations of clinical drug delivery protocols

Alec N Salt et al. Laryngoscope. 2008 Oct.

Abstract

Objectives/hypothesis: To establish safe dosing protocols for the treatment of patients with Meniere's disease with intratympanic gentamicin.

Study design: A validated computer model of gentamicin dispersion in the inner ear fluids was used to calculate cochlear drug levels resulting from specific clinical delivery protocols. Dosing in the cochlea was compared with changes of hearing sensitivity for 568 patients reported in 19 publications.

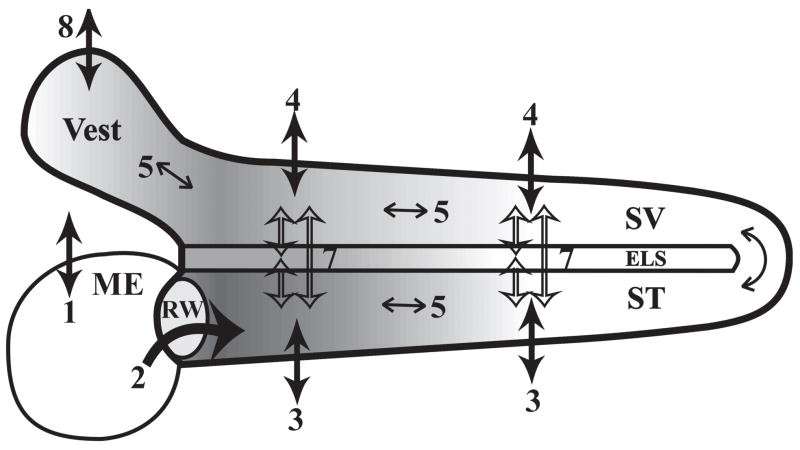
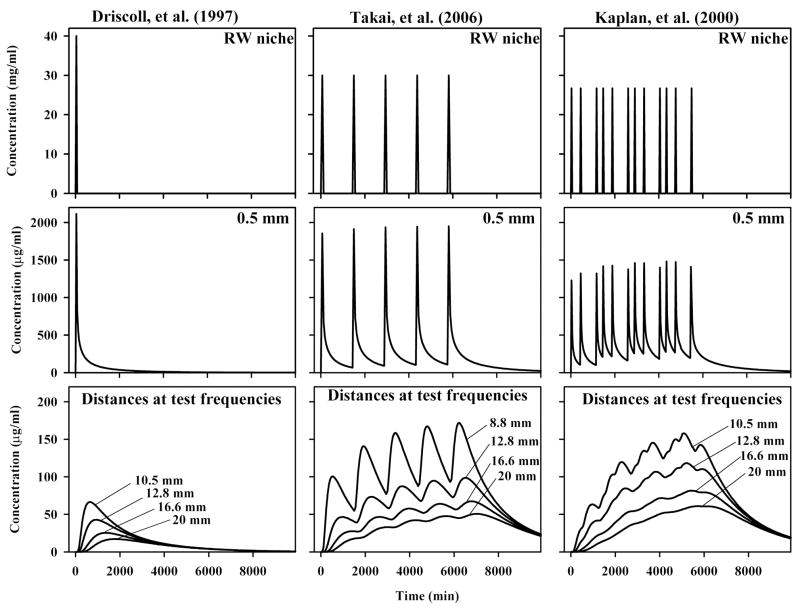
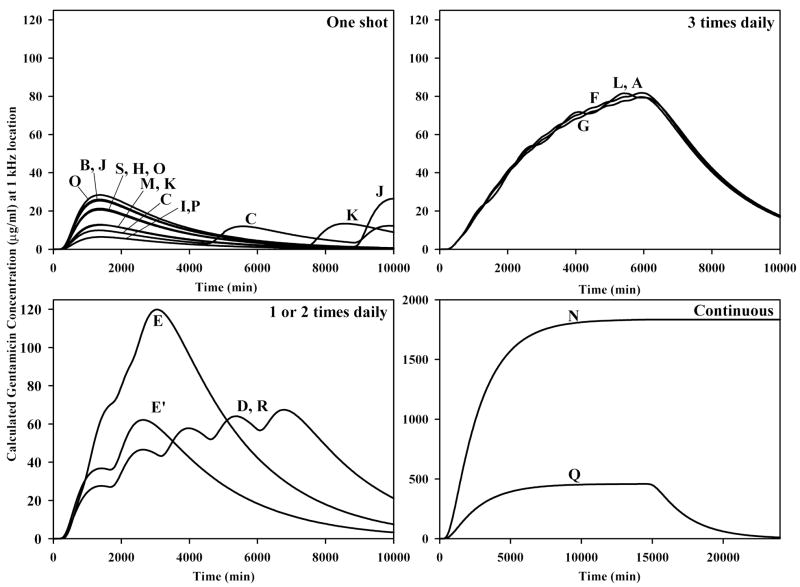
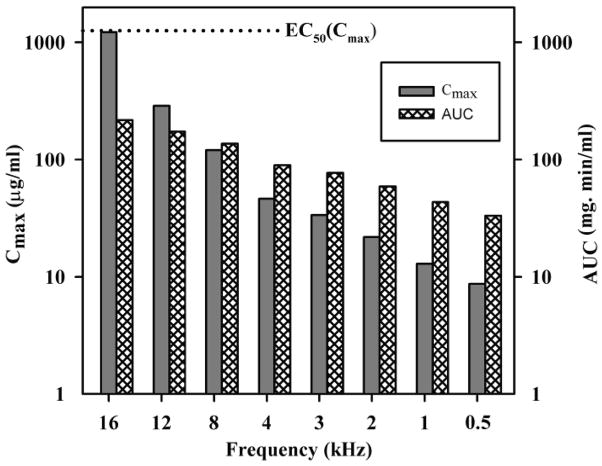
Methods: Cochlear drug levels were calculated based on the concentration and volume of gentamicin applied, the time the drug remained in the middle ear, and on the specific timing of injections. Time courses were quantified in terms of the maximum concentration (Cmax) and the area under the curve of the drug at specific cochlear locations.

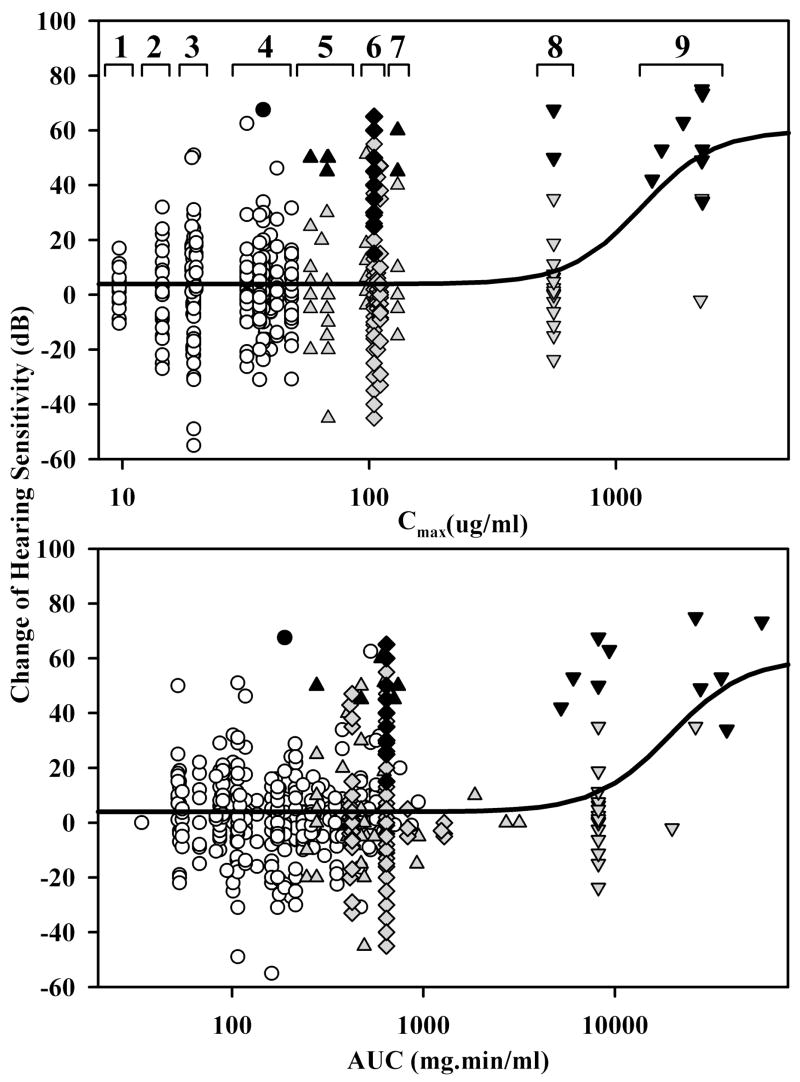
Results: Drug levels resulting from single, "one-shot" injections were typically lower than those from repeated or continuous application protocols. Comparison of hearing sensitivity changes with gentamicin dosing revealed a flat curve with a near-zero mean for lower doses, suggesting that hearing changes with doses over this range were probably unrelated to the applied drug. Higher intracochlear doses were generated with repeated or continuous delivery protocols, which in some cases caused substantial hearing losses and an increased incidence of deafened ears.

Conclusions: One-shot application protocols produce gentamicin doses in the cochlea that have minimal risk to hearing at the frequencies tested. Repeated or continuous application protocols result in higher doses that in some cases damage hearing. The high variability of hearing changes, even with low gentamicin doses, calls into question the rationale for using individual hearing changes to titrate the applied dose.


Figures

Figure 1
Figure 1
Processes involved in gentamicin distribution in the inner ear (adapted from Plontke et al.. They include 1) Clearance from the middle ear (ME); 2) Permeability of the round window (RW) membrane; 3) Clearance from scala tympani (ST) to blood; 4) Clearance from scala vestibuli (SV) to blood; 5) Diffusion along the scalae; 6) ST-SV communication through the helicotrema; 7) Inter scala communications (ST-endolymphatic space (ELS), SV-ELS, ST-SV); 8) Clearance from the vestibule (Vest) to blood.
Figure 2
Figure 2
Calculated gentamicin dosing for 3 protocols, specifically a single injection (Driscoll et al.12), daily injections (Takei et al.28) and 3 times daily injections (Kaplan et al.22). In each case, the dose applied to the RW niche is given (top row) and the level produced in the basal turn of scala tympani near the RW membrane, 0.5 mm from the base (middle row). The bottom row shows concentration time courses at the cochlear locations corresponding to the frequencies tested, which are (with distances from the base of ST shown in parentheses): 4000 Hz (8.8 mm), 3000 Hz (10.5 mm), 2000 Hz (12.8 mm), 1000 Hz (16.6 mm), 500 Hz (20 mm). Cmax and AUC were calculated for each of the four curves and the four values were averaged for comparison with hearing sensitivity changes. For the repeated application protocols there is little accumulation of drug in the basal turn (0.5 mm), but there is a pronounced cumulative effect for cochlear locations more distant (10 – 20 mm) from the application site.
Figure 3
Figure 3
Calculated concentrations at the 1 kHz region of the cochlea (16.6 mm from the base of ST) for all the application protocols analyzed in this study. The letter on each curve refers to the specific study indicated in Table 1. With one-shot protocols repeated at 3 or more days apart (C, K, J) there is negligible accumulation of drug at this location so each injection is regarded as an independent treatment. With daily dosing (E′, D, R) there is a slow build up of concentration with each injection. The rate of build up is greater with twice daily injections (E) and 3 times daily injections (A, F, G, L). With continuous application protocols, much higher doses reach this region (N, Q). Note the 16x difference in axis scaling used for the continuous injection protocol plots.
Figure 4
Figure 4
Dependence of reported hearing sensitivity changes on the calculated gentamicin dose at the locations along scala tympani corresponding to the auditory frequencies tested. Dose was quantified either as the maximum concentration (Cmax: upper plot) or as the area under the curve (AUC: lower plot) averaged for specific locations in each study. The symbols represent the four delivery protocols depicted in Figure 3 (circles: one-shot; triangles: one or two times daily; diamonds: 3 times daily; inverted trangles: continuous). Open circles highlight the one shot protocol, while multiple injection (diamonds, triangles) and continuous protocols (inverted triangles) are shown shaded. Solid black symbols indicate patients who were deaf after the gentamicin treatment. Details of the fitted Hill functions are given in the text. In the calculation of Cmax, the studies from Table 1 within each of the numbered groups were 1: M; 2: C; 3: I, K, P; 4: B, H, J, O, S; 5: D, E; 6: A, F, G, L, R; 7: E; 8: Q; 9: N.
Figure 5
Figure 5
Calculation of Cmax and AUC for frequency locations corresponding to distances along scala tympani following a one shot injection according to the protocol of Minor, a protocol that is calculated to produce low drug levels in the cochlea (from Group 3 in Figure 4). Even though the gentamicin dose reaching regions corresponding to frequencies of 4 kHz and below is well below the EC50 (shown as a dotted line), higher frequency regions, such as 16 kHz may be exposed to higher drug levels approaching the EC50. Calculated AUC levels also increase for higher frequencies but do not come close to the EC50 for the AUC of 19,403 mg·min/ml (substantially exceeding the upper limit of the graph scale).

Similar articles

Cited by

References

    1. Lange G. The intratympanic treatment of Meniere’s disease with ototoxic antibiotics. A follow-up study of 55 cases. Laryngol Rhinol Otol. 1977;56:409–414. - PubMed
    1. Lange G. Gentamicin and other ototoxic antibiotics for the transtympanic treatment of Meniere’s disease. Arch Otorhinolaryngol. 1989;246:269–270. - PubMed
    1. Lange G. 27 years experiences with transtympanic aminoglycoside treatment of Meniere’s disease. Laryngorhinootologie. 1995;74:720–723. - PubMed
    1. Salt AN, Ma Y. Quantification of solute entry into cochlear perilymph through the round window membrane. Hear Res. 2001;154:88–97. - PubMed
    1. Mynatt R, Hale SA, Gill RM, et al. Demonstration of a longitudinal concentration gradient along scala tympani by sequential sampling of perilymph from the cochlear apex. J Assoc Res Otolaryngol. 2006;7:182–193. - PMC - PubMed

Publication types