

doi: 10.1038/nmeth.1255.
Epub 2008 Sep 21.
Tracking the structural dynamics of proteins in solution using time-resolved wide-angle X-ray scattering
Affiliations
- PMID: 18806790
- PMCID: PMC3159148
- DOI: 10.1038/nmeth.1255
Item in Clipboard
Tracking the structural dynamics of proteins in solution using time-resolved wide-angle X-ray scattering
Nat Methods.
2008 Oct.
Erratum in
- Nat Methods.2008 Nov;5(11):988
Abstract
We demonstrate tracking of protein structural changes with time-resolved wide-angle X-ray scattering (TR-WAXS) with nanosecond time resolution. We investigated the tertiary and quaternary conformational changes of human hemoglobin under nearly physiological conditions triggered by laser-induced ligand photolysis. We also report data on optically induced tertiary relaxations of myoglobin and refolding of cytochrome c to illustrate the wide applicability of the technique. By providing insights into the structural dynamics of proteins functioning in their natural environment, TR-WAXS complements and extends results obtained with time-resolved optical spectroscopy and X-ray crystallography.
Figures
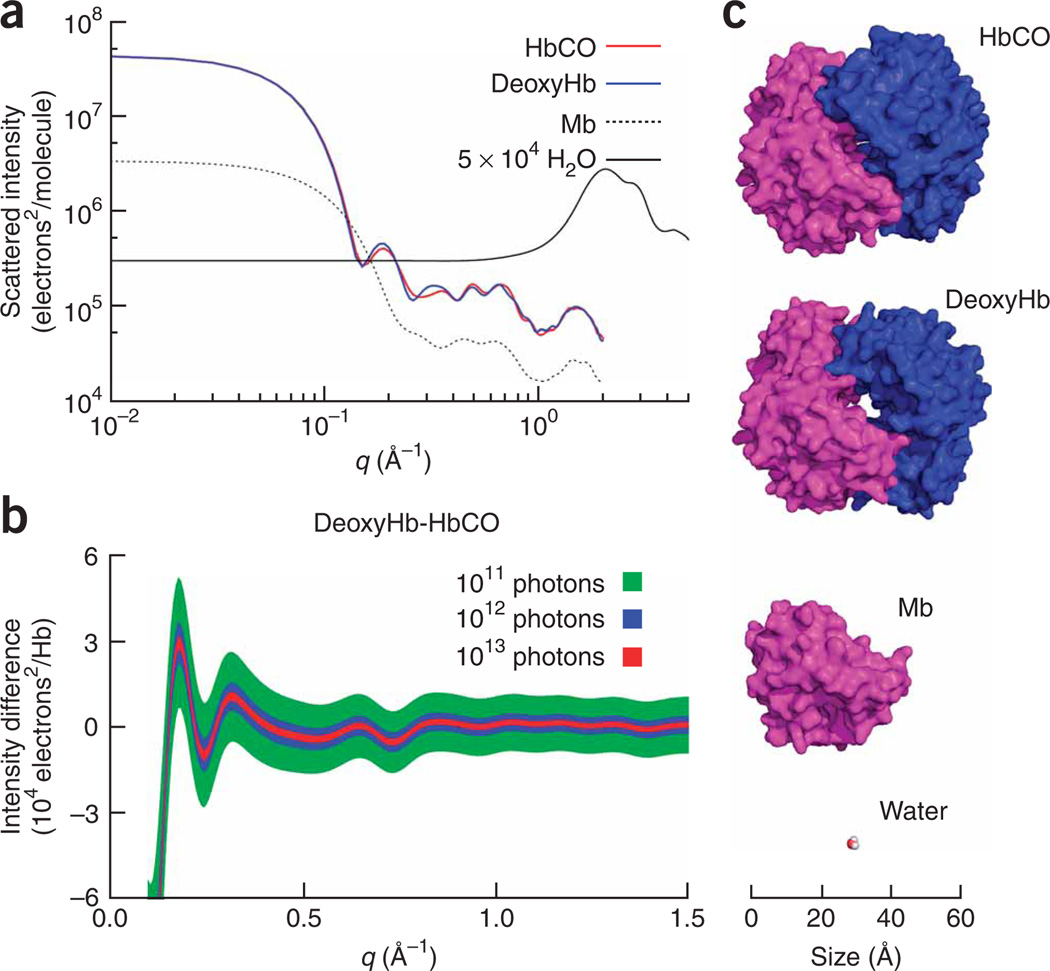
Plausibility of TR-WAXS based on photon statistics considerations. (a) Calculated X-ray patterns for the relevant protein structures together with the water pattern scaled for a 1 mM protein solution (~5 × 10⁴ H2O molecules for each Hb molecule). The scattered intensity is expressed in units of electrons2/protein molecule. The HbCO, deoxyHb and Mb scattering patterns were calculated using the PDB files 1BBB, 2HHB and 1DWR, respectively. (b) Calculated deoxyHb-HbCO difference pattern for three photon fluxes. The line thickness represents one s.d. of the signal that had been calculated under the assumption of shot noise–limited data. At least 1012 photons had to be accumulated to resolve the characteristic oscillations of the difference patterns. (c) Snapshots of the molecular structures used in the calculations of scattering patterns generated using PyMOL (DeLano, W.L. The PyMOL User’s Manual, DeLano Scientific, 2002). In the case of Hb, the αβ dimers involved in the quaternary structure transition are colored differently.

TR-WAXS methodology and data processing. (a) Schematic representation of the experimental setup. Transient structures were generated by a laser pulse (green beam) that triggered the conformational change (through photolysis of the Hb-CO bond), which was followed by delayed quasi-monochromatic X-ray pulses (100 ps long) extracted from the synchrotron (blue circle). Scattered X-rays were recorded in the forward direction by a sensitive CCD camera. The red arrow indicates the direction of electron flow inside the synchotron. (b) Each image was azimuthally averaged and converted into a one-dimensional curve. I, intensity. (c) After normalization, a reference scattering pattern, which probed the unexcited sample, was subtracted from the scattering pattern at a given time delay. These difference patterns are ’fingerprints’ of the transient protein structural changes. (d) Low-resolution snapshots depict the expected time-dependent structural changes. Regions of the protein involved in structural rearrangements are colored red. As the laser pulse (green arrow) photolyzes Hb-CO bonds, the protein undergoes tertiary structural changes (in less than 150 ns) followed by the R to T transition (3 µs time scale). Full rebinding occurs at slower time scales (1–10 ms).

TR-WAXS data on hemoglobin and the solvent heating contribution. (a) TR-WAXS data at 100 µs after photolysis compared with that at 32 ms (multiplied by 2); 32 ms after photolysis, the unbound CO molecules have recombined to Hb and the scattering signal is due essentially to a temperature rise of the solvent. The 32-ms pattern was used to subtract the solvent response at any time delay after proper scaling. (b) The solvent response–subtracted time-resolved data at 100 µs after photolysis compared with the static equilibrium scattering difference between a deoxyHb equilibrium sample and an HbCO sample. (c) Laser-induced changes of the scattering patterns for several selected time delays (black, after solvent response subtraction). Data at all time delays have been fitted as a linear combination of the difference patterns at 200 ns and 100 µs (red). The TR-WAXS pattern obtained at 10 ns from photolysis of MbCO is shown to demonstrate the sensitivity of the technique to local tertiary structural changes. (d) The population kinetics of R-like species and T-like species estimated from TR-WAXS data. (e) Schematic representation of Hb structural dynamics between about 100 ns and 100 ms from photolysis.

Comparison between TR-WAXS scattering differences and scattering differences calculated from crystallographic structures. (a) The time-resolved difference pattern measured 100 µs after photolysis of HbCO is compared to the difference pattern calculated from the R2 and T crystallographic structures (PDB files 1BBB and 2HHB were used as models of the R2 and T structures, respectively). (b) Snapshot of the CO-bound alpha subunit. The E and F helices form the ‘clamshell’ that holds the heme in place. The blue arrows indicate the direction of the E and F motion during the ‘clamshell relaxation’. (c) Comparison of the 200 ns time-resolved data with the difference pattern calculated from the R2 crystal structure and its modified unligated version mimicking the effect of the clamshell relaxation.

Application of TR-WAXS to track folding of Cyt-c. (a) Schematic representation of light-induced folding of Cyt-c. (b) Time-resolved WAXS data relative to CO photolysis–induced folding of Cyt-c. A 200 ns laser pulse at 532 nm initiated photodissociation of the CO ligand, which in turn initiated the folding process. Experimental data at representative time delays are shown. (c) Population of the folded state as a function of time estimated from a linear combination of the experimental signal at 32 µs and 0.2 s.
References
-
- Moffat K. Ultrafast time-resolved crystallography. Nat. Struct. Biol. 1998;5:641–643. - PubMed
-
- Schotte F, et al. Watching a protein as it functions with 150-ps time-resolved X-ray crystallography. Science. 2003;300:1944–1947. - PubMed
-
- Grishaev A, Wu J, Trewhella J, Bax A. Refinement of multidomain protein structures by combination of solution small-angle X-ray scattering and NMR data. J. Am. Chem. Soc. 2005;127:16621–16628. - PubMed
-
- Xu X, et al. Dynamics in a pure encounter complex of two proteins studied by solution scattering and paramagnetic NMR spectroscopy. J. Am. Chem. Soc. 2008;130:6395–6403. - PubMed
Publication types
MeSH terms
Substances
Grants and funding
LinkOut - more resources
Full Text Sources
