. 2008 Oct;14(10):1059-66.
doi: 10.1038/nm.1870. Epub 2008 Sep 21.

Inhibition of lipoprotein-associated phospholipase A2 reduces complex coronary atherosclerotic plaque development

Affiliations

Inhibition of lipoprotein-associated phospholipase A2 reduces complex coronary atherosclerotic plaque development

Robert L Wilensky et al. Nat Med. 2008 Oct.

Abstract

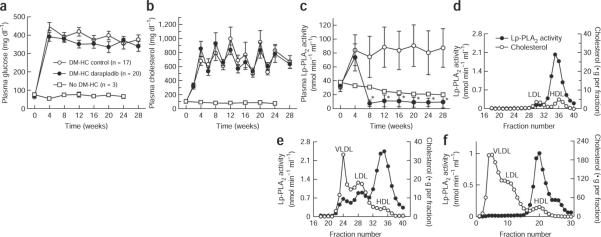
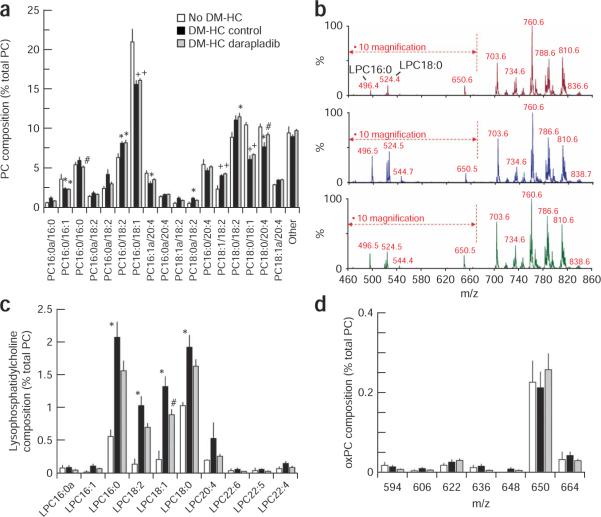
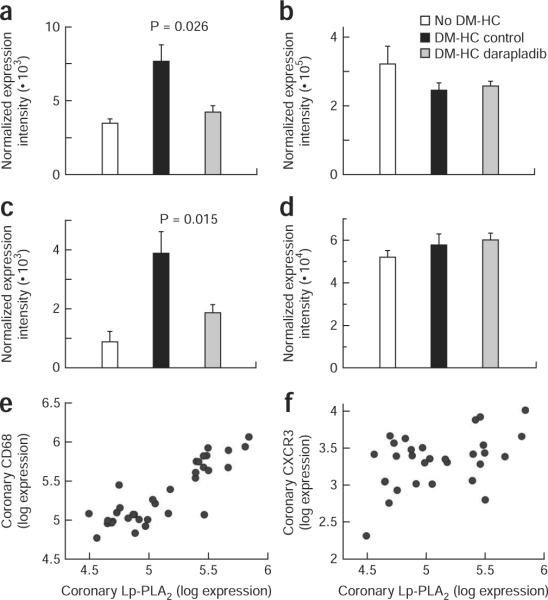
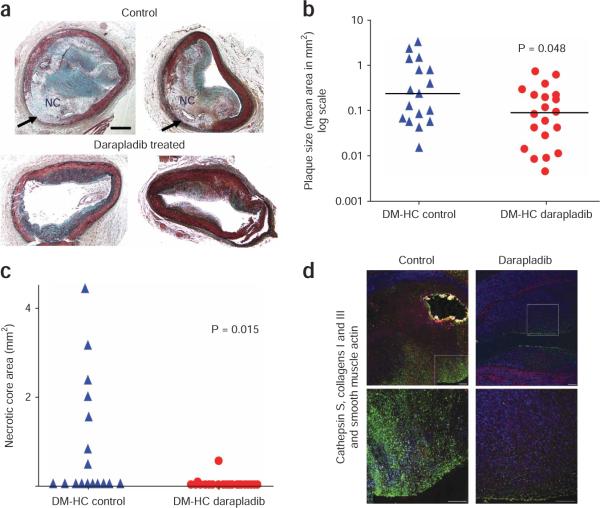
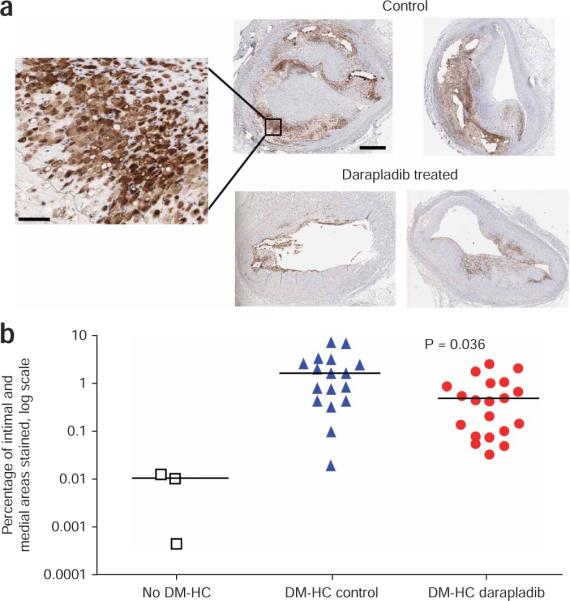
Increased lipoprotein-associated phospholipase A(2) (Lp-PLA(2)) activity is associated with increased risk of cardiac events, but it is not known whether Lp-PLA(2) is a causative agent. Here we show that selective inhibition of Lp-PLA(2) with darapladib reduced development of advanced coronary atherosclerosis in diabetic and hypercholesterolemic swine. Darapladib markedly inhibited plasma and lesion Lp-PLA(2) activity and reduced lesion lysophosphatidylcholine content. Analysis of coronary gene expression showed that darapladib exerted a general anti-inflammatory action, substantially reducing the expression of 24 genes associated with macrophage and T lymphocyte functioning. Darapladib treatment resulted in a considerable decrease in plaque area and, notably, a markedly reduced necrotic core area and reduced medial destruction, resulting in fewer lesions with an unstable phenotype. These data show that selective inhibition of Lp-PLA(2) inhibits progression to advanced coronary atherosclerotic lesions and confirms a crucial role of vascular inflammation independent from hypercholesterolemia in the development of lesions implicated in the pathogenesis of myocardial infarction and stroke.


Figures

Figure 1
Figure 1
Plasma glucose, cholesterol and Lp-PLA2 activity increase upon DM-HC induction, but only Lp-PLA2 activity is influenced by darapladib. (a–c) Pigs underwent DM-HC induction on day 0. Four weeks later, pigs were assigned to either a control or a treated group, and 10 mg kg−1 darapladib was orally administered daily to the treated group. Three age- and sex-matched pigs did not undergo DM-HC induction as a second control group. Plasma glucose (a), cholesterol (b) and Lp-PLA2 activity (c) levels were monitored throughout the 28-week study period. *P < 0.0001 darapladib-treated DM-HC pigs versus control DM-HC pigs. Data shown are means ± s.e.m. for glucose and cholesterol and means ± s.d. for Lp-PLA2 activity. n = 3 for control non–DM-HC pigs, n = 17 for control DM-HC pigs and n = 20 for darapladib-treated DM-HC pigs. (d,e) Distribution of Lp-PLA2 activity after gel filtration for lipoprotein fractionation of pooled plasma samples from DM-HC control pigs before induction (d) or at completion of the study at week 28 (e; n = 17 pigs in a pooled sample). (f) For comparison, a similar lipoprotein profile was obtained from pooled plasma from six double-transgenic mice expressing both human apolipoprotein B100 and CETP and fed a Western diet. HDL, high-density lipoprotein.
Figure 2
Figure 2
Influence of DM-HC induction and darapladib on arterial phospholipid composition. (a–d) Total lipid extracts from iliac arteries harvested at the end of the study were analyzed by mass spectrometry. All results were calculated relative to the total concentration of PC within each sample and are expressed as means ± s.e.m. Data shown are for individual PC species (a), a representative spectrum from each study group (b; top, no DM-HC; middle, DM-HC control; bottom, DM-HC darapladib), individual LPC species (c) and individual oxidized PC (oxPC) species (d). The relative contributions of LPC species with a m/z smaller than 670 are magnified by a factor of ten so that all species can be visualized on a single graph. The nomenclature used to denote PC molecular species is PC w:x/y:z, where PC is the phosphorylcholine headgroup and `w:z' and `y:z' denote the fatty acyl moieties esterified at the sn – 1 and sn – 2 positions, repsectively. For each fatty acyl group, `w' and `y' denote the number of carbon atoms, whereas `x' and `z' denote the number of unsaturated double bonds. PC species with fatty acids attached by an ether (alkyl) bond instead of an ester (acyl) bond are denoted by `a'. For a: +P < 0.0001 versus no DM-HC; *P < 0.05 versus no DM-HC; #P < 0.05 control versus darapladib. For c: *P < 0.01 no DM-HC versus DM-HC control; #P < 0.05 control versus darapladib. n = 3 no DM-HC, n = 16 DM-HC control and n = 18 DM-HC darapladib.
Figure 3
Figure 3
Inhibition of Lp-PLA2 reduces leukocyte subset marker abundance in coronary arteries in the absence of an effect in blood PBMCs. (a–d) Expression of the genes encoding the MCP-1 chemokine receptor CCR2 (a,b) and the IP-10 chemokine receptor CXCR3 (c,d) at the end of study in coronary arteries (a,c) and circulating PMBCs (b,d). (e,f) Correlation between coronary expression of the genes encoding Lp-PLA2 and CD68 (e, r = 0.81, P < 0.0001, n = 34) and between coronary expression of the genes encoding Lp-PLA2 and CXCR3 (f, r = 0.33, not significant, n = 29).
Figure 4
Figure 4
Darapladib treatment reduces complex coronary lesion development. (a) Photomicrograph of the two largest lesions observed in each study group (Movat's pentachrome stains). Arrows point to areas of medial destruction observed primarily in the control arteries. NC, necrotic core. Scale bar, 0.5 mm. (b) Mean plaque size in coronary arteries of DM-HC pigs left untreated or treated with darapladib. The bars represent median values. (c) Coronary artery necrotic core size in DM-HC pigs left untreated or treated with darapladib. (d) For each study group, a cross-section of the coronary artery adjacent to the lesion with the largest area (shown in a) was stained for the presence of macrophages (cathepsin S, FITC, green), collagens I and III (Texas Red) and smooth muscle α-actin (7-amino-4-methyl-3-coumarinylacetic acid (AMCA), blue). Yellow staining represents autofluorescence in the area of a focal calcification. The bottom images are higher magnifications of the top images. I, intima; L, lumen; M, medial layer. Scale bar, 100 μM.
Figure 5
Figure 5
Inhibition of Lp-PLA2 results in fewer lesion macrophages in coronary arteries. Cathepsin S immunohistochemical staining was used as a marker of lesion macrophages and quantified in both the intima and media. (a) Staining of the two largest lesions observed in each study group (the same lesions as shown in Figure 4a); the inset clearly shows staining in cells. Scale bars, 0.5 mm and 25 μm (inset). (b) Quantification of lesion macrophage areas in the three study groups. The bars represent median values. The groups being compared for the P value are DM-HC control and DM-HC darapladib.

Comment in

References

    1. Ross R. Atherosclerosis—an inflammatory disease. N. Engl. J. Med. 1999;340:115–126. - PubMed
    1. Hansson GK, Libby P. The immune response in atherosclerosis: a double-edged sword. Nat. Rev. Immunol. 2006;6:508–519. - PubMed
    1. Steinberg D. Thematic review series: the pathogenesis of atherosclerosis. An interpretive history of the cholesterol controversy, part V: the discovery of the statins and the end of the controversy. J. Lipid Res. 2006;47:1339–1351. - PubMed
    1. Witztum JL. The oxidation hypothesis of atherosclerosis. Lancet. 1994;344:793–795. - PubMed
    1. Shah PK. Molecular mechanisms of plaque instability. Curr. Opin. Lipidol. 2007;18:492–499. - PubMed

Publication types

MeSH terms