. 2008 Sep 22:8:89.
doi: 10.1186/1471-213X-8-89.

Generation of diverse neuronal subtypes in cloned populations of stem-like cells

Affiliations

Generation of diverse neuronal subtypes in cloned populations of stem-like cells

Balázs V Varga et al. BMC Dev Biol. .

Abstract

Background: The central nervous tissue contains diverse subtypes of neurons with characteristic morphological and physiological features and different neurotransmitter phenotypes. The generation of neurons with defined neurotransmitter phenotypes seems to be governed by factors differently expressed along the anterior-posterior and dorsal-ventral body axes. The mechanisms of the cell-type determination, however, are poorly understood. Selected neuronal phenotypes had been generated from embryonic stem (ES) cells, but similar results were not obtained on more restricted neural stem cells, presumably due to the lack of homogeneous neural stem cell populations as a starting material.

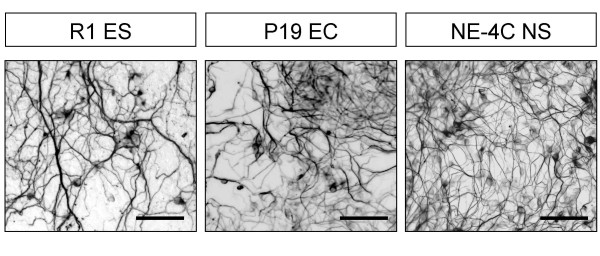
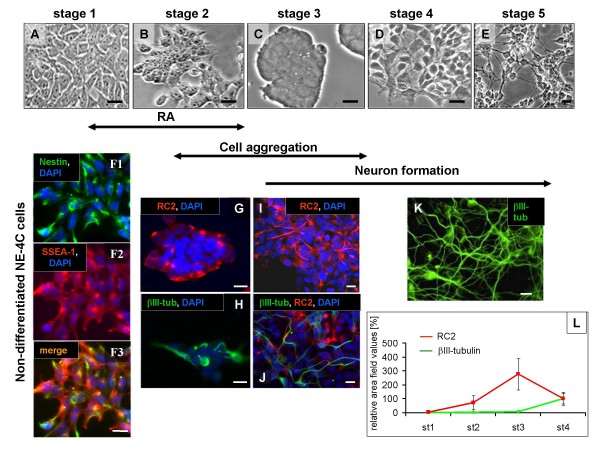
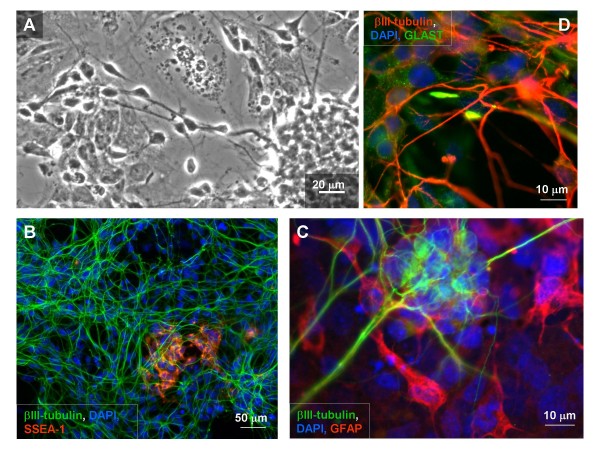
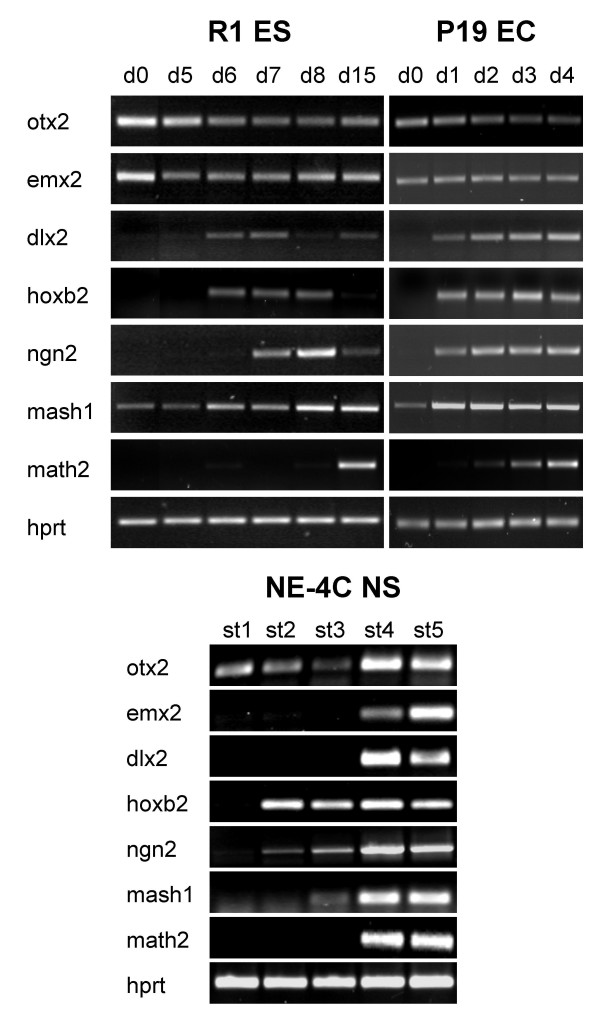
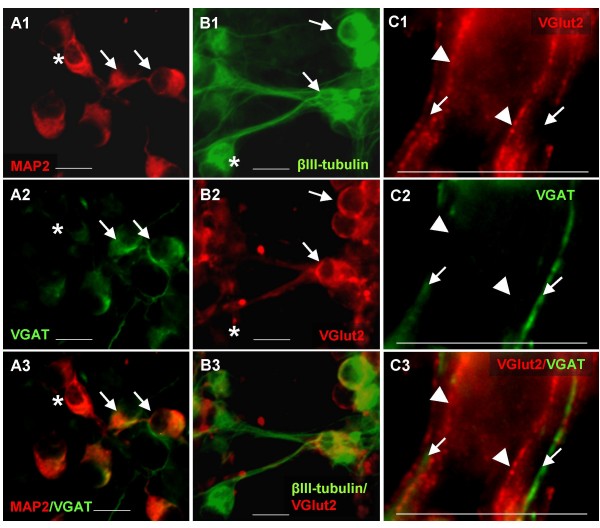
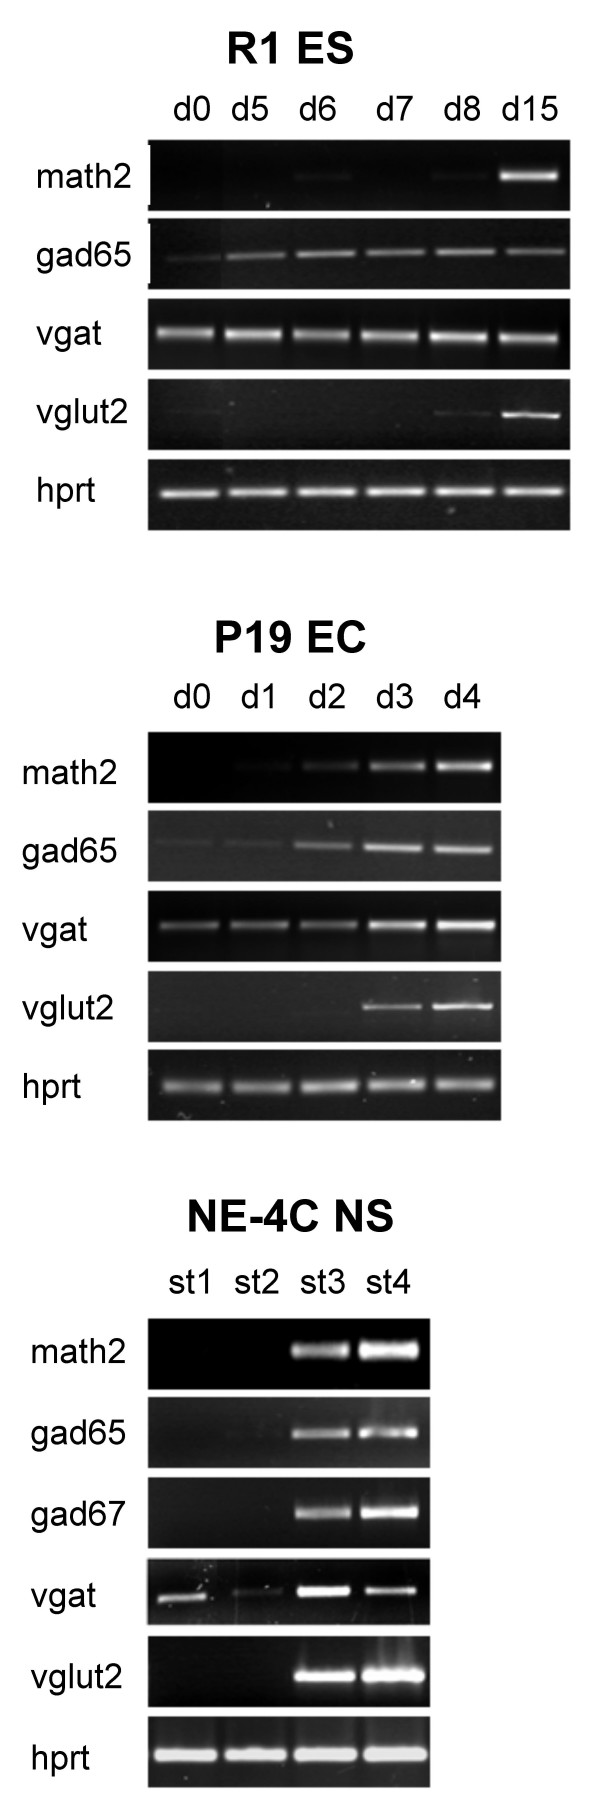
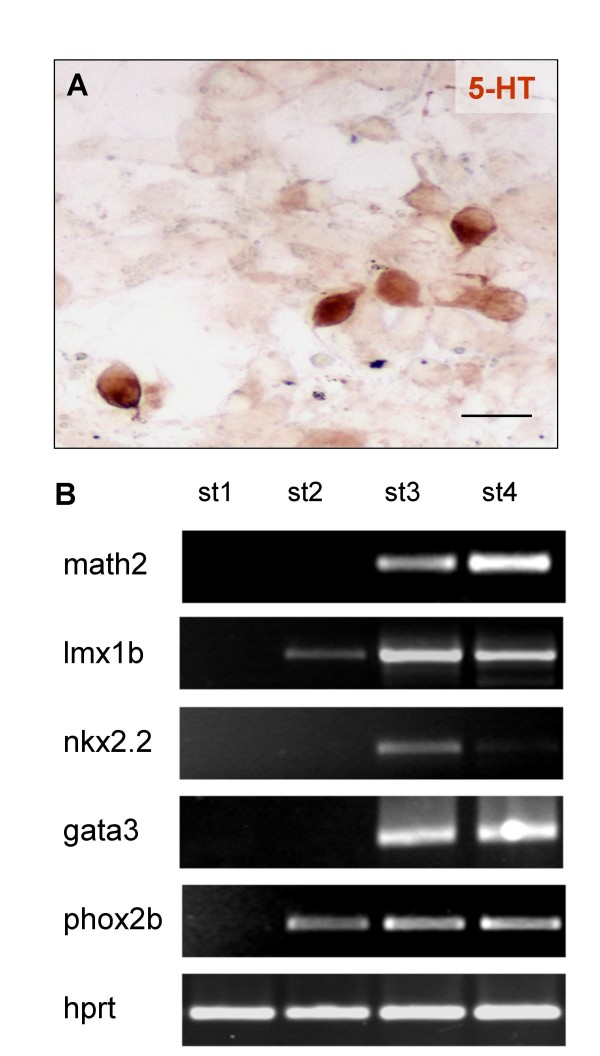
Results: In the presented work, the establishment of different neurotransmitter phenotypes was investigated in the course of in vitro induced neural differentiation of a one-cell derived neuroectodermal cell line, in conjunction with the activation of various region-specific genes. For comparison, similar studies were carried out on the R1 embryonic stem (ES) and P19 multipotent embryonic carcinoma (EC) cells. In response to a short treatment with all-trans retinoic acid, all cell lines gave rise to neurons and astrocytes. Non-induced neural stem cells and self-renewing cells persisting in differentiated cultures, expressed "stemness genes" along with early embryonic anterior-dorsal positional genes, but did not express the investigated CNS region-specific genes. In differentiating stem-like cell populations, on the other hand, different region-specific genes, those expressed in non-overlapping regions along the body axes were activated. The potential for diverse regional specifications was induced in parallel with the initiation of neural tissue-type differentiation. In accordance with the wide regional specification potential, neurons with different neurotransmitter phenotypes developed. Mechanisms inherent to one-cell derived neural stem cell populations were sufficient to establish glutamatergic and GABAergic neuronal phenotypes but failed to manifest cathecolaminergic neurons.

Conclusion: The data indicate that genes involved in positional determination are activated along with pro-neuronal genes in conditions excluding any outside influences. Interactions among progenies of one cell derived neural stem cells are sufficient for the activation of diverse region specific genes and initiate different routes of neuronal specification.


Figures

Figure 1
Figure 1
Neurons develop from ES, EC and NE-4C cells in response to treatment with retinoic acid. Cultures were stained for neuron-specific βIII-tubulin in a phase of differentiation corresponding to stage 4 of NE-4C development: the 15th day of induced differentiation of R1 (ES), the 4th day for P19 (EC) and the 7th day for NE-4C. Bars: 50 μm
Figure 2
Figure 2
Morphological and immunocytochemical characteristics of NE-4C cells at defined stages of RA induced neural differentiation. A-E: Phase contrast views of differentiating NE-4C cultures from stage 1 to stage 5. Non-induced (stage 1) NE-4C cells show epithel-like morphology (A) and immune-reactivity for nestin and SSEA-1 (F1–F3). RC2 immune-positive cells appear at stage 2 (B), and their frequency increases with formation and compaction of the aggregates (C, G) at stage 3. The first βIII-tubulin-positive neuronal precursors (H) appear inside the compact aggregates (C). At stage 4, cells migrate out from the aggregates (D), and form a two-layer arrangement with a basal substrate-attached monolayer and loose neuronal aggregates on the top of it (J). Morphologically "mature" neurons appear by the end of the first week of induction (stage 5) and form dense networks on the surface of a substrate-attached monolayer (E, K). By the time neurogenesis reaches its highest level, the number of RC2 immune-positive radial-glia like cells decreases (L). Averages of fluorescence area-values for RC2 and βIII-tubulin (see M&M) staining were related to the DAPI-stained area-value representing all cell nuclei, on the same microscopic field. Data are presented as percentages of the related area-values obtained from stage 4 cultures (100%; n = 4). Bars: 10 μm
Figure 3
Figure 3
Differentiated (stage 6) NE-4C cultures contain neurons and astrocytes, but populations of non-differentiated cells persist. Phase contrast view (A) shows the arrangement of neurons on the top of a substrate-attached monolayer of non-neuronal cells. SSEA-1 positive non-differentiated cells (red on B) are located in the substrate-attached monolayer beneath the network of βIII-tubulin (green) immunoreactive neurons. GFAP positive astroglial cells (red on C) appear in the substrate-attached monolayer and inside the loose neuronal aggregates among βIII-tubulin (green) immunoreactive neurons. In stage 6, morphologically mature neurons (D) develop in the vicinity of developing and mature glial cells stained for the GLAST glutamate transporter (green). Bars: 20 μm for A, 50 μm for B and 10 μm for C and D
Figure 4
Figure 4
Activation of region-specific genes is turned on after the onset of neural differentiation. RT-PCR analyses on the expression of otx2, emx2, dlx2, hox2b region-specific, ngn2, mash1 proneural and math2 neuron-specific genes, in non-induced (d0; st1) and in neuron-enriched (d15, d4, st4) cultures of R1 (ES), P19 (EC) and NE-4C (neural stem) cells, respectively.
Figure 5
Figure 5
Flow-cytometric demonstration of SSEA-1 immunoreactive cells (green dots) in differentiated (stage 6) NE-4C cultures. The dot plot (A) shows the SSEA-1 positive population (R2) characterized by high phyco-erythrine (PE) fluorescence (≥ 600; y-axis) against a non-specific auto fluorescence (FITC; x-axis). The histogram (B) and the statistics (C) showed an about 5% frequency of SSEA-1 positive cells among the total cells (R1; 100%) defined by forward scatter (FSC) value ≥ 200.
Figure 6
Figure 6
Non-differentiated, SSEA-1 positive cells re-cloned from differentiated NE-4C cultures display neural stem cell properties. Non-differentiated cells re-cloned from differentiated (stage 6) cultures displayed epithelial morphology (A) but gave rise to neurons (B) and astrocytes (C) if induced with RA. βIII-tubulin immunoreactive neurons (B) and GFAP-positive astroglial cells (C) visualized by HRP-DAB reaction are shown in a representative clone (clone 0901). Bars: 50 μm on A, C and 100 μm on B. D: Investigated sub-clones (clone 0901; 0905; 1204) showed a gene expression pattern characteristic to non-induced (stage1) NE-4C cells, but expressed a variety of region-specific genes after reaching more differentiated stage (st4).
Figure 7
Figure 7
Expression of region-specific genes in cultures of NE-4C neural stem cells at different stages of neural differentiation. A group of region-specific genes including pax6, gbx2, and hoxb2 was activated at the time of switching on proneural (e.g. ngn2) genes. The expression of another set of "positional" genes (dlx2, emx2, otx3) was detected in a later phase of differentiation, along with the activation of math2 neuronal gene.
Figure 8
Figure 8
Neuron formation and gene expression after short- or long-term exposure to RA. Differentiation of NE-4C cells was induced by exposure to 10-6 M RA for 12, 72 or 168 hours. A: The number of neurons was determined by counting NeuN-positive nuclei after a 168-hour period of differentiation (stage 4). In comparison to longer (72-hour or 168-hour) treatments, short term (12-hour) induction resulted in less NeuN-positive neurons. (Averages and standard deviation values were calculated from 4 identically treated sister-cultures (n = 4)). B: Short-term (12-hour) or long-term (72 or 168 hours) presence of RA did not cause significant changes in the expression of hox2b, gbx2 and pax6 genes. The continuous presence of RA did not inhibit the expression of the dorsal forebrain specific emx2 gene, but was sufficient to reduce the RA-sensitive otx2 mRNA level. The results of a representative RT-PCR assay on non-induced (stage 1; left column) and differentiated, neuron-rich (stage 4; three right columns) cultures are shown.
Figure 9
Figure 9
NE-4C derived neurons can acquire different neurotransmitter phenotypes. A: Double immune-staining for MAP2 (red; A1, A3) neuronal marker and for VGAT (green; A2, A3) GABAergic neuronal marker showed that VGAT staining was confined to neurons, but not all neurons displayed VGAT-immune-reactivity. Arrows mark double immune-reactive cells; asterisk indicates a VGAT-negative neuron. B: Double immune-staining for βIII-tubulin (green; B1, B3) and VGLUT2 (red; B2, B3) glutamatergic neuronal marker demonstrated the presence of both glutamatergic (arrows) and non-glutamatergic neurons. Asterisk marks βIII-tubulin positive but VGLUT2 negative neurons. C: Double staining for VGAT (green; C2, C3) and VGLUT2 (red; C1, C3) revealed a complete segregation of GABAergic (arrows) and glutamatergic (arrowheads) processes. Immunostaining was made on differentiated NE-4C cultures at stage 6. Bars: 10 μm
Figure 10
Figure 10
Expression of genes indicating glutamatergic and GABAergic neuronal phenotypes. The expression of the GABAergic phenotype-related gad67 or gad65 and the glutamatergic vglut2 genes was detected in math2 expressing, neuron rich cultures of all (R1 ES, P19 EC and NE-4C NS) cell lines. Unexpectedly, vgat was expressed by all types of non-induced stem cells. Samples were taken on different stages of neural differentiation; for R1 ES on days 0,5,6,7,8,15 (see M&M); for P19 EC on days 0, 1, 2, 3, 4 after RA-induction; for NE-4C NS: at stages 1,3,4,5 (see Table 1).
Figure 11
Figure 11
Monoaminergic features in differentiating NE-4C cultures. A: 5HT staining of NE-4C derived neurons at stage 5, scale bar: 10 μm. Approximately 1% of the neurons contained 5 HT (see also Table 2). B: Several genes coding for transcription factors involved in the differentiation of monoaminergic neurons were transcribed in stage 4 and 5 neuron rich (math2 expressing) cultures.

Similar articles

Cited by

References

    1. Sasai , Yoshiki Identifying the Missing Links: Genes that Connect Neural Induction and Primary Neurogenesis in Vertebrate Embryos. Neuron. 1998;21:455–458. doi: 10.1016/S0896-6273(00)80554-1. - DOI - PubMed
    1. Aruga , Jun The role of Zic genes in neural development. Molecular and Cellular Neuroscience. 2004;26:205–221. doi: 10.1016/j.mcn.2004.01.004. - DOI - PubMed
    1. Shimamura K, Hartigan D, Martinez S, Puelles L, Rubenstein J. Longitudinal organization of the anterior neural plate and neural tube. Development. 1995;121:3923–3933. - PubMed
    1. Lumsden A, Krumlauf R. Patterning the Vertebrate Neuraxis. Science. 1996;274:1109–1115. doi: 10.1126/science.274.5290.1109. - DOI - PubMed
    1. Ruiz i Altaba A, Nguyen V, Palma V. The emergent design of the neural tube: prepattern, SHH morphogen and GLI code. Current Opinion in Genetics & Development. 2003;13:513–521. doi: 10.1016/j.gde.2003.08.005. - DOI - PubMed

Publication types