

Comparison of Poisson and Bernoulli spatial cluster analyses of pediatric injuries in a fire district
- PMID: 18808720
- PMCID: PMC2559834
- DOI: 10.1186/1476-072X-7-51
Comparison of Poisson and Bernoulli spatial cluster analyses of pediatric injuries in a fire district
Abstract
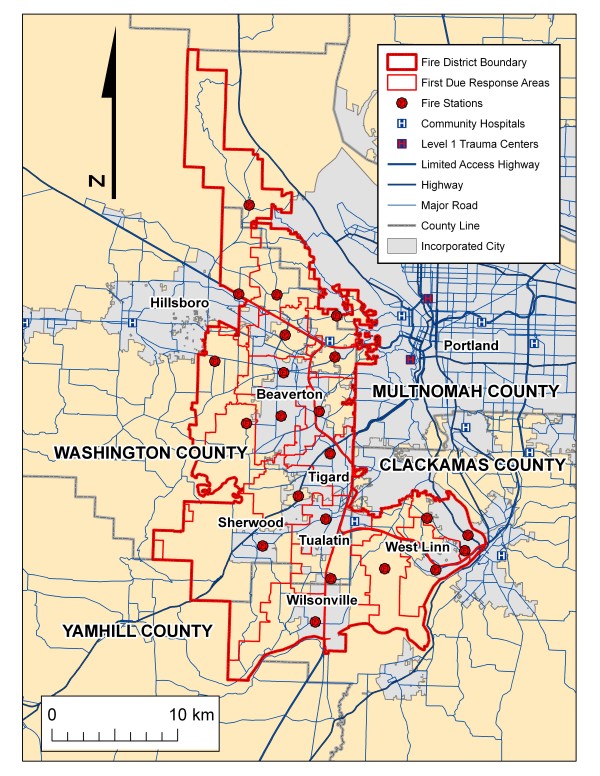
Background: With limited resources available, injury prevention efforts need to be targeted both geographically and to specific populations. As part of a pediatric injury prevention project, data was obtained on all pediatric medical and injury incidents in a fire district to evaluate geographical clustering of pediatric injuries. This will be the first step in attempting to prevent these injuries with specific interventions depending on locations and mechanisms.
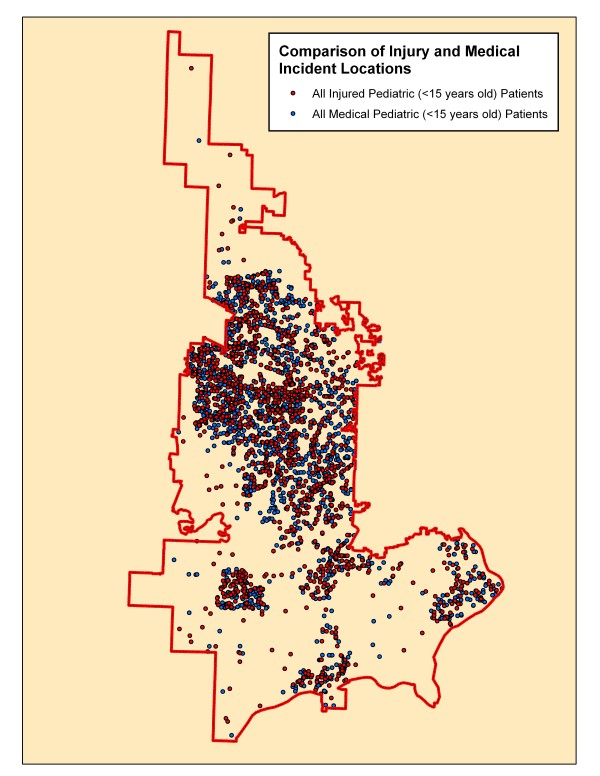
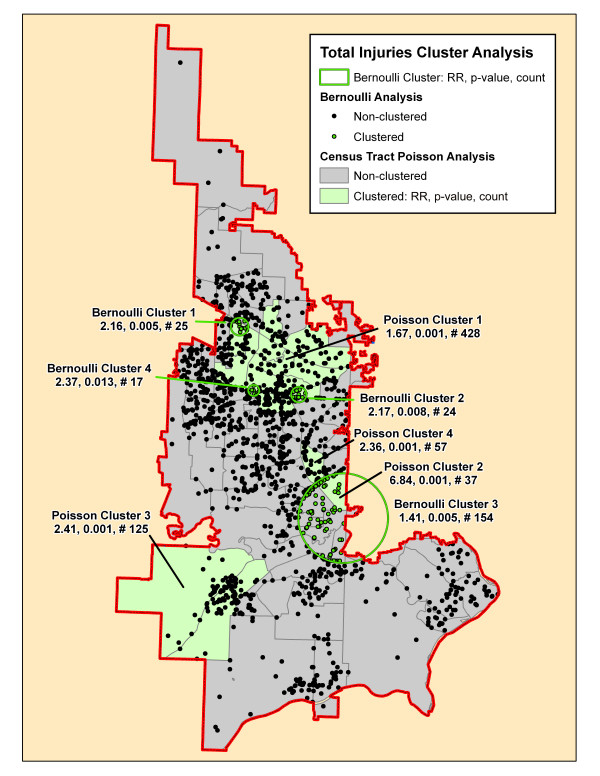
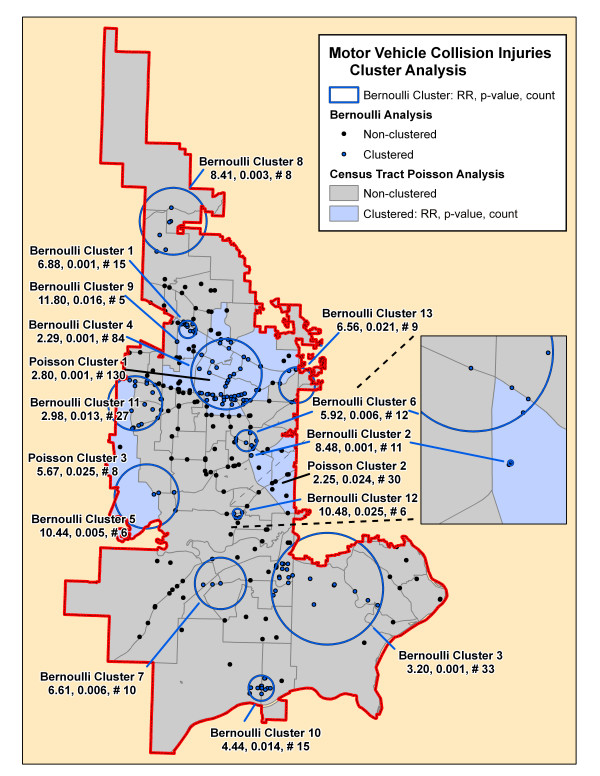
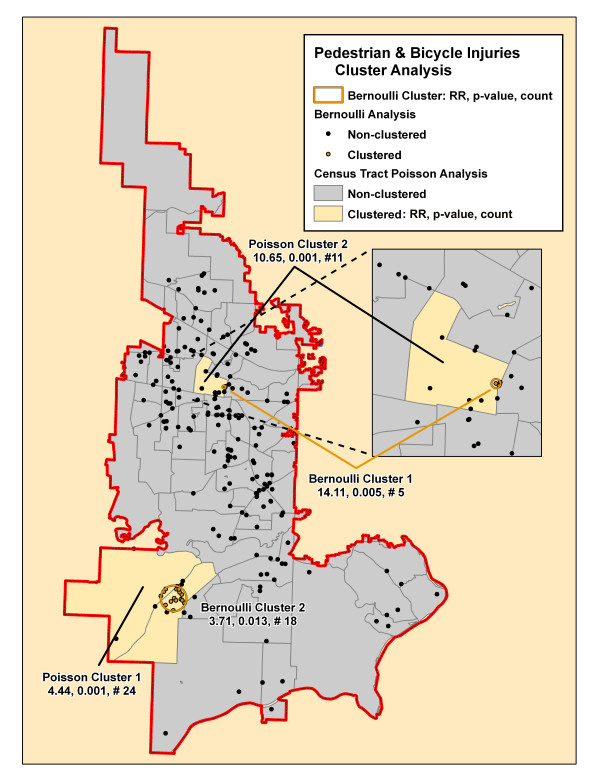
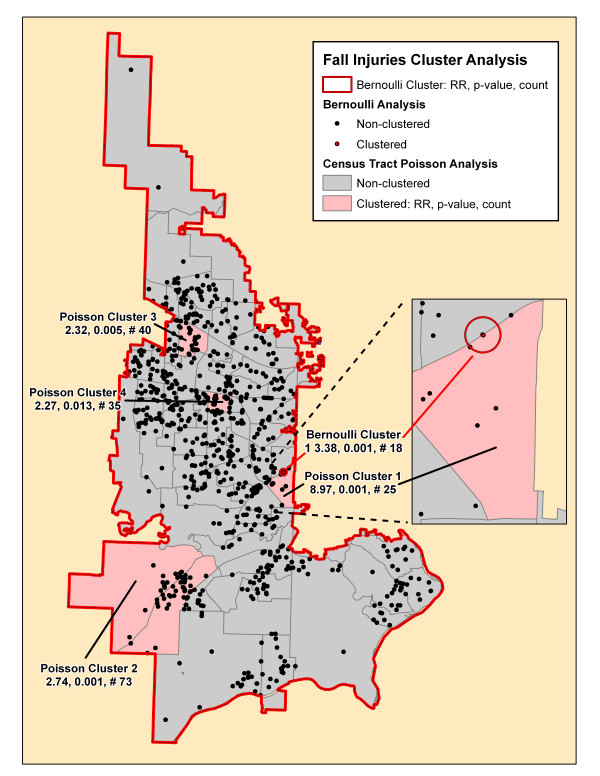
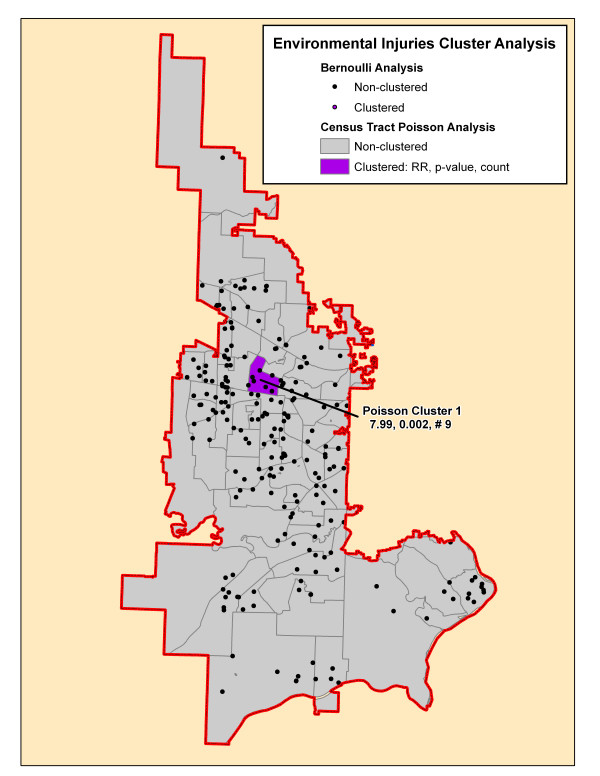
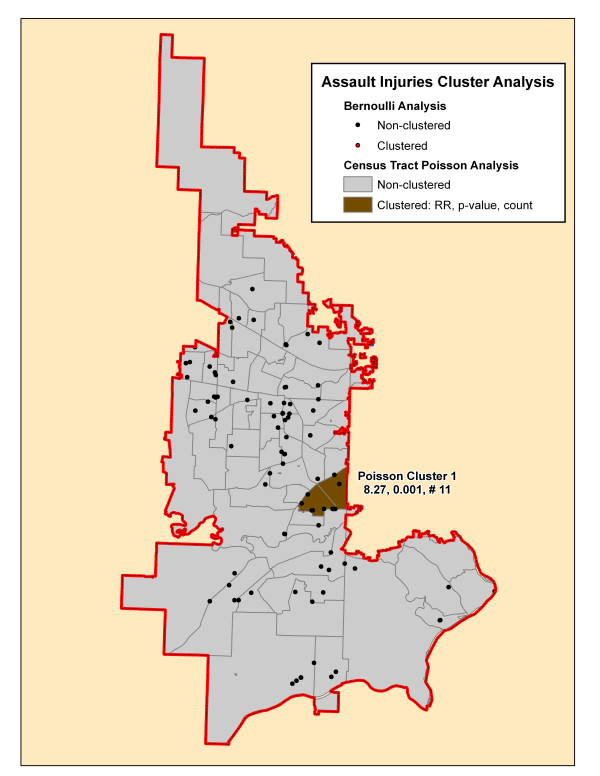
Results: There were a total of 4803 incidents involving patients less than 15 years of age that the fire district responded to during 2001-2005 of which 1997 were categorized as injuries and 2806 as medical calls. The two cohorts (injured versus medical) differed in age distribution (7.7 +/- 4.4 years versus 5.4 +/- 4.8 years, p < 0.001) and location type of incident (school or church 12% versus 15%, multifamily residence 22% versus 13%, single family residence 51% versus 28%, sport, park or recreational facility 3% versus 8%, public building 8% versus 7%, and street or road 3% versus 30%, respectively, p < 0.001). Using the medical incident locations as controls, there was no significant clustering for environmental or assault injuries using the Bernoulli method while there were four significant clusters for all injury mechanisms combined, 13 clusters for motor vehicle collisions, one for falls, and two for pedestrian or bicycle injuries. Using the Poisson cluster method on incidence rates by census tract identified four clusters for all injuries, three for motor vehicle collisions, four for fall injuries, and one each for environmental and assault injuries. The two detection methods shared a minority of overlapping geographical clusters.
Conclusion: Significant clustering occurs overall for all injury mechanisms combined and for each mechanism depending on the cluster detection method used. There was some overlap in geographic clusters identified by both methods. The Bernoulli method allows more focused cluster mapping and evaluation since it directly uses location data. Once clusters are found, interventions can be targeted to specific geographic locations, location types, ages of victims, and mechanisms of injury.
Figures
Similar articles
-
Targeting pediatric pedestrian injury prevention efforts: teasing the information through spatial analysis.J Trauma. 2011 Nov;71(5 Suppl 2):S511-6. doi: 10.1097/TA.0b013e31823a4b70. J Trauma. 2011. PMID: 22072037
-
Are school zones effective? An examination of motor vehicle versus child pedestrian crashes near schools.Inj Prev. 2009 Aug;15(4):226-9. doi: 10.1136/ip.2008.020446. Inj Prev. 2009. PMID: 19651993
-
Injuries as a public health problem in sub-Saharan Africa: epidemiology and prospects for control.East Afr Med J. 2000 Dec;77(12 Suppl):S1-43. East Afr Med J. 2000. PMID: 12862115
-
Pediatric pedestrian injuries: emergency care considerations.Pediatr Emerg Care. 2007 Oct;23(10):738-44. doi: 10.1097/PEC.0b013e318156acea. Pediatr Emerg Care. 2007. PMID: 18090111 Review.
-
Cervical spine injuries in children: a review of 103 patients treated consecutively at a level 1 pediatric trauma center.J Pediatr Surg. 2001 Aug;36(8):1107-14. doi: 10.1053/jpsu.2001.25665. J Pediatr Surg. 2001. PMID: 11479837 Review.
Cited by
-
An empirical comparison of spatial scan statistics for outbreak detection.Int J Health Geogr. 2009 Apr 16;8:20. doi: 10.1186/1476-072X-8-20. Int J Health Geogr. 2009. PMID: 19371431 Free PMC article.
-
Identifying the patterns and sizes of the first lumpy skin disease outbreak clusters in Northern Thailand with a high degree of dairy farm aggregation using spatio-temporal models.PLoS One. 2023 Nov 15;18(11):e0291692. doi: 10.1371/journal.pone.0291692. eCollection 2023. PLoS One. 2023. PMID: 37967138 Free PMC article.
-
Evidence of spatial clustering of childhood acute lymphoblastic leukemia cases in Greater Mexico City: report from the Mexican Inter-Institutional Group for the identification of the causes of childhood leukemia.Front Oncol. 2024 Feb 14;14:1304633. doi: 10.3389/fonc.2024.1304633. eCollection 2024. Front Oncol. 2024. PMID: 38420017 Free PMC article.
-
Spatial distribution and determinants of unmet need for family planning among all reproductive‑age women in Uganda: a multi‑level logistic regression modeling approach and spatial analysis.Contracept Reprod Med. 2024 Feb 2;9(1):4. doi: 10.1186/s40834-024-00264-0. Contracept Reprod Med. 2024. PMID: 38303010 Free PMC article.
-
Identification of Spatial Clusters of Undervaccination Patterns Among Children Aged <24 Months Using Immunization Information System Data, Montana, 2015-2019.Public Health Rep. 2024 May-Jun;139(3):360-368. doi: 10.1177/00333549231186603. Epub 2023 Jul 28. Public Health Rep. 2024. PMID: 37503702 Free PMC article.
References
-
- Jiang X, et al. Variations in injury among Canadian adolescents by urban-rural geographic status. Chronic Dis Can. 2007;28:56–62. - PubMed
MeSH terms
LinkOut - more resources
Full Text Sources
Medical
Research Materials
