

Rate of entorhinal and hippocampal atrophy in incipient and mild AD: relation to memory function
- PMID: 18809228
- PMCID: PMC2873053
- DOI: 10.1016/j.neurobiolaging.2008.08.003
Rate of entorhinal and hippocampal atrophy in incipient and mild AD: relation to memory function
Abstract
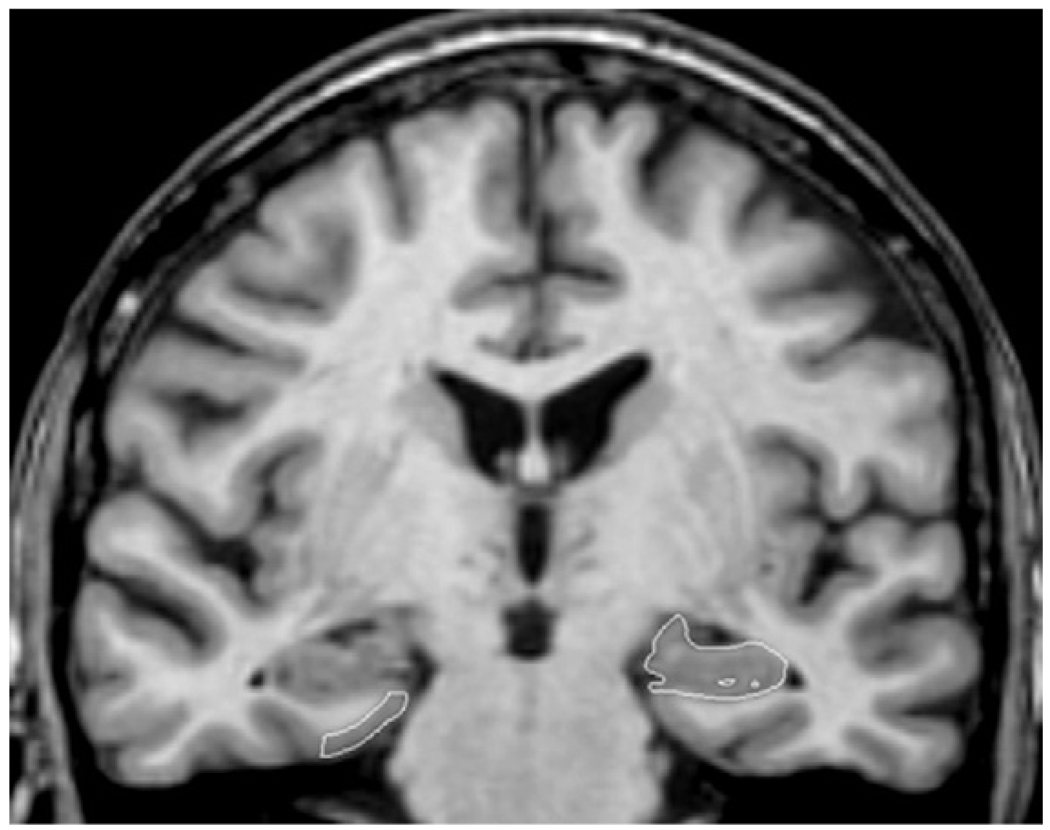
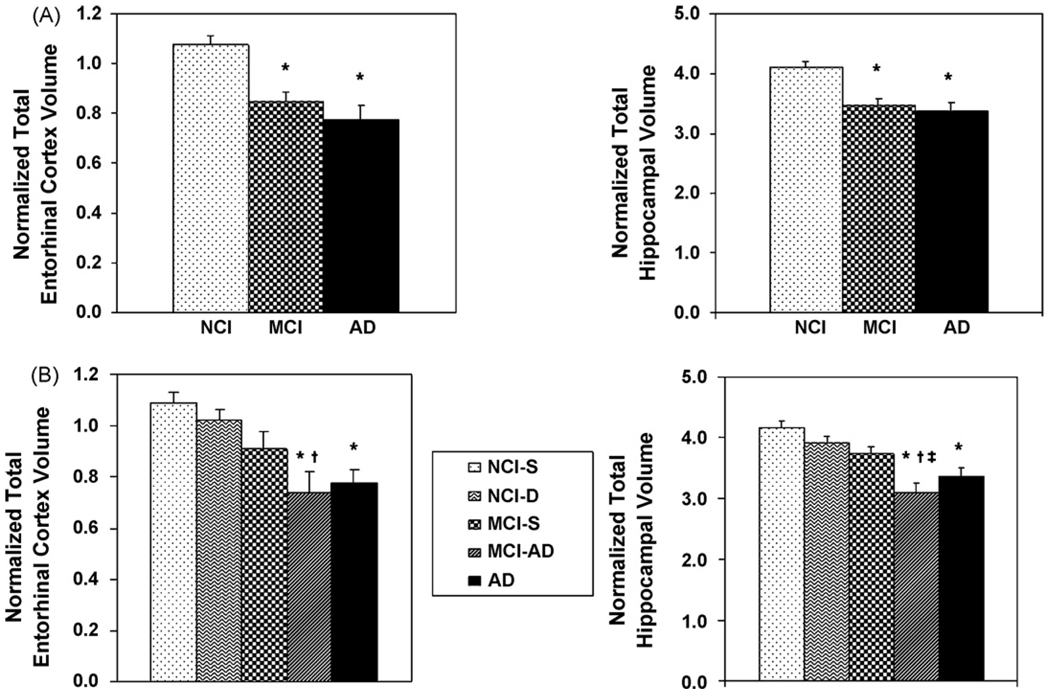
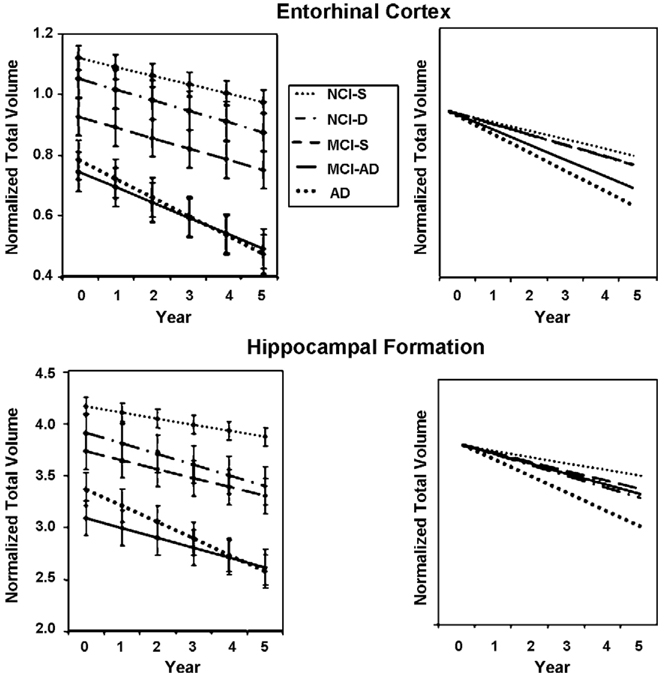
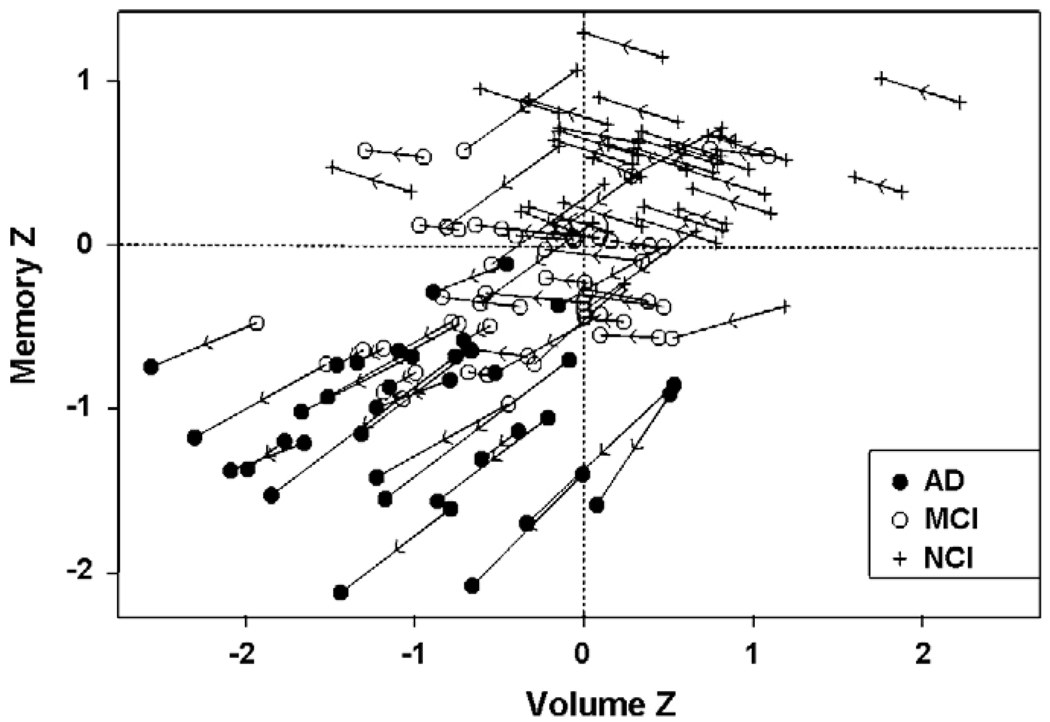
In the present study, as part of a more extensive longitudinal investigation of the in vivo anatomical markers of early and incipient AD in our laboratory, three groups of elderly participants were followed with yearly clinical evaluations and high resolution MRI scans over a 6-year period (baseline and 5 years of follow-up). At baseline, participants consisted of: (1) 35 old subjects with no cognitive impairment (controls); (2) 33 participants with amnestic mild cognitive impairment (MCI); and (3) 14 patients with very mild AD. 11 participants with amnestic MCI received a diagnosis of AD over the follow-up period and 9 controls declined in cognitive function. T1 weighted MRI scans were acquired using a 3D SPGR pulse sequence. At baseline, both the amnestic MCI and mild AD groups differed from the controls in hippocampal and entorhinal cortex volume, but not from each other. Longitudinal analyses showed that the rate of atrophy of the entorhinal cortex and hippocampus for the stable controls differed significantly from MCI participants who converted to AD and the AD groups. Furthermore, longitudinal decreases in hippocampal and entorhinal volume were related to longitudinal decline in declarative memory performance. These findings suggest that the rate of atrophy of mesial temporal lobe structures can differentiate healthy from pathological aging.
Copyright 2008 Elsevier Inc. All rights reserved.
Conflict of interest statement
The authors do not have any actual or potential conflicts of interest.
Figures
Similar articles
-
Hippocampal and entorhinal atrophy in mild cognitive impairment: prediction of Alzheimer disease.Neurology. 2007 Mar 13;68(11):828-36. doi: 10.1212/01.wnl.0000256697.20968.d7. Neurology. 2007. PMID: 17353470
-
MRI predictors of risk of incident Alzheimer disease: a longitudinal study.Neurology. 2005 May 10;64(9):1520-4. doi: 10.1212/01.WNL.0000160089.43264.1A. Neurology. 2005. PMID: 15883311
-
MRI-derived entorhinal volume is a good predictor of conversion from MCI to AD.Neurobiol Aging. 2004 Oct;25(9):1197-203. doi: 10.1016/j.neurobiolaging.2003.12.007. Neurobiol Aging. 2004. PMID: 15312965
-
From healthy aging to early Alzheimer's disease: in vivo detection of entorhinal cortex atrophy.Ann N Y Acad Sci. 2000 Jun;911:240-53. doi: 10.1111/j.1749-6632.2000.tb06730.x. Ann N Y Acad Sci. 2000. PMID: 10911878 Review.
-
Structural magnetic resonance imaging for the early diagnosis of dementia due to Alzheimer's disease in people with mild cognitive impairment.Cochrane Database Syst Rev. 2020 Mar 2;3(3):CD009628. doi: 10.1002/14651858.CD009628.pub2. Cochrane Database Syst Rev. 2020. PMID: 32119112 Free PMC article.
Cited by
-
Differential Regulation of Wnt Signaling Components During Hippocampal Reorganization After Entorhinal Cortex Lesion.Cell Mol Neurobiol. 2021 Apr;41(3):537-549. doi: 10.1007/s10571-020-00870-x. Epub 2020 May 20. Cell Mol Neurobiol. 2021. PMID: 32435957 Free PMC article.
-
Heterogeneity of cognitive trajectories in diverse older persons.Psychol Aging. 2010 Sep;25(3):606-19. doi: 10.1037/a0019502. Psychol Aging. 2010. PMID: 20677882 Free PMC article.
-
Neuroimaging enrichment strategy for secondary prevention trials in Alzheimer disease.Alzheimer Dis Assoc Disord. 2010 Jul-Sep;24(3):269-77. doi: 10.1097/WAD.0b013e3181d1b814. Alzheimer Dis Assoc Disord. 2010. PMID: 20683184 Free PMC article.
-
Dissecting the age-related decline on spatial learning and memory tasks in rodent models: N-methyl-D-aspartate receptors and voltage-dependent Ca2+ channels in senescent synaptic plasticity.Prog Neurobiol. 2012 Mar;96(3):283-303. doi: 10.1016/j.pneurobio.2012.01.007. Epub 2012 Jan 28. Prog Neurobiol. 2012. PMID: 22307057 Free PMC article. Review.
-
Research on nonstroke dementia screening and cognitive function prediction model for older people based on brain atrophy characteristics.Brain Behav. 2022 Nov;12(11):e2726. doi: 10.1002/brb3.2726. Epub 2022 Oct 24. Brain Behav. 2022. PMID: 36278400 Free PMC article.
References
-
- Albert M, Smith L, Scherr P, Taylor J, Evans D, Funkenstein H. Use of brief cognitive tests to identify individuals in the community with clinically diagnosed Alzheimer’s disease. Int. J. Neurosci. 1991;57:167–178. - PubMed
-
- Apostolova LG, Dutton RA, Dinov ID, Hayashi KM, Toga AW, Cummings JL, Thompson PM. Conversion of mild cognitive impairment to Alzheimer’s disease predicted by hippocampal atrophy maps. Arch. Neurol. 2006;63:693–699. - PubMed
-
- Bennett DA, Wilson RS, Schneider JA, Evans DA, Beckett LA, Aggarwal NT, Barnes LL, Fox JH, Bach J. Natural history of mild cognitive impairment in older persons. Neurology. 2002;59:198–205. - PubMed
-
- Bennett DA, Schneider JA, Buchman AS, Mendes de Leon CF, Bienias JL, Wilson RS. The Rush Memory and Aging Project: study design and baseline characteristics of the study cohort. Neuroepidemiology. 2005;25:163–175. - PubMed
-
- Bobinski M, de Leon MJ, Convit A, De Santi S, Wegiel J, Tarshish CY, Louis LAS, Wisniewski HM. MRI of entorhinal cortex in mild Alzheimer’s disease. Lancet. 1999;353:38–40. - PubMed
Publication types
MeSH terms
Grants and funding
LinkOut - more resources
Full Text Sources
Medical
