. 2008 Dec;28(24):7323-36.
doi: 10.1128/MCB.00889-08. Epub 2008 Sep 22.

Histone modifications, but not nucleosomal positioning, correlate with major histocompatibility complex class I promoter activity in different tissues in vivo

Affiliations

Histone modifications, but not nucleosomal positioning, correlate with major histocompatibility complex class I promoter activity in different tissues in vivo

Aparna S Kotekar et al. Mol Cell Biol. 2008 Dec.

Abstract

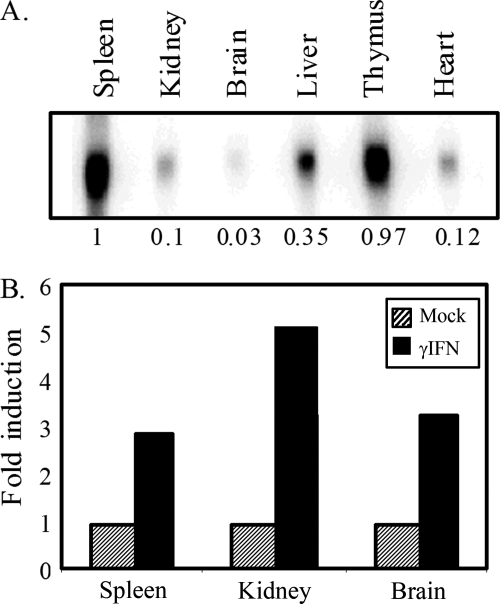
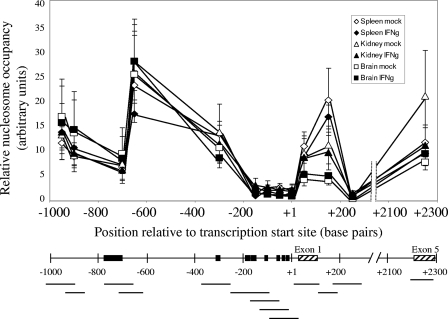
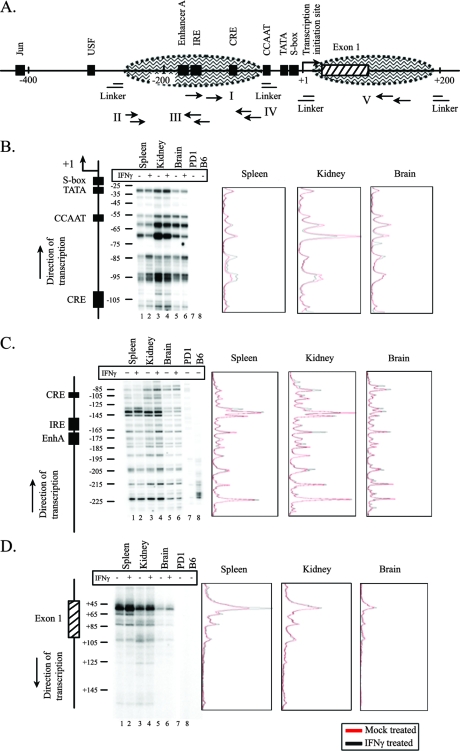
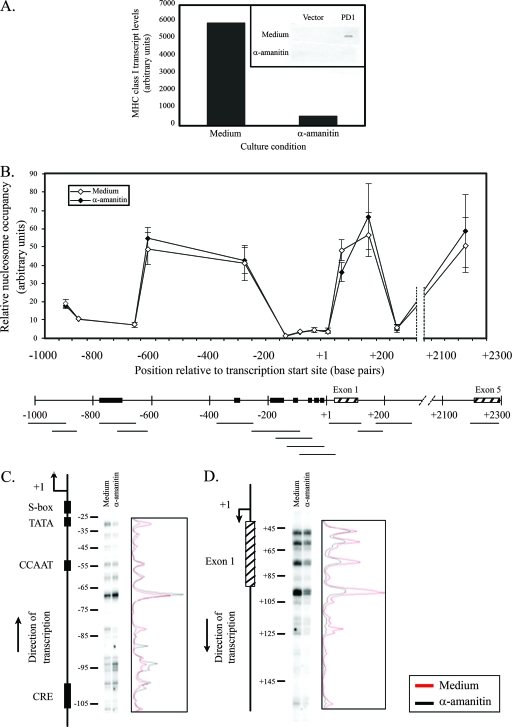
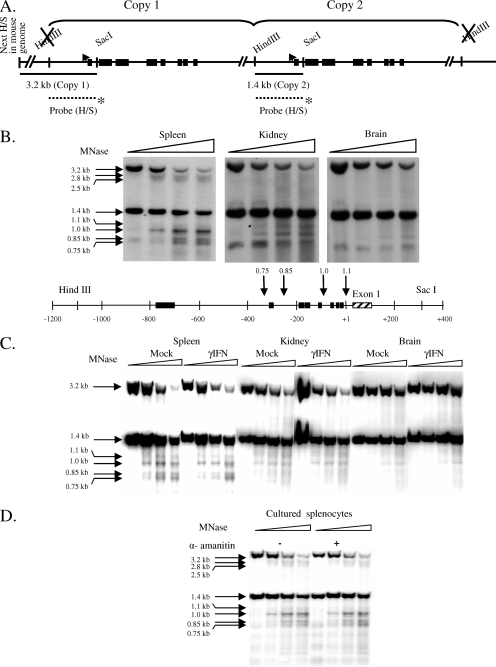
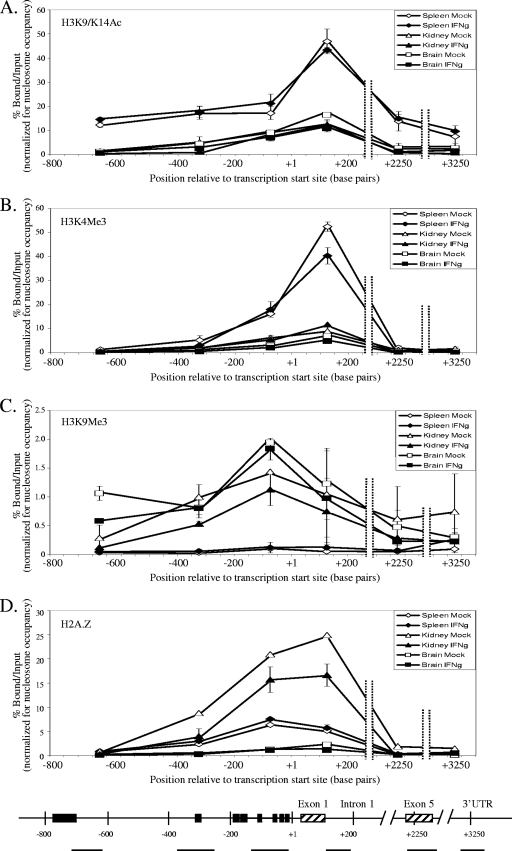
To examine the role of chromatin in transcriptional regulation of the major histocompatibility complex (MHC) class I gene, we determined nucleosome occupancy and positioning, histone modifications, and H2A.Z occupancy across its regulatory region in murine tissues that have widely different expression levels. Surprisingly, nucleosome occupancy and positioning were indistinguishable between the spleen, kidney, and brain. In all three tissues, the 200 bp upstream of the transcription start site had low nucleosome occupancy. In contrast, nuclease hypersensitivity, histone modifications, and H2A.Z occupancy showed tissue-specific differences. Thus, tissue-specific differences in MHC class I transcription correlate with histone modifications and not nucleosomal organization. Further, activation of class I transcription by gamma interferon or its inhibition by alpha-amanitin did not alter nucleosome occupancy, positioning, nuclease hypersensitivity, histone modifications, or H2A.Z occupancy in any of the tissues examined. Thus, chromatin remodeling was not required to dynamically modulate transcriptional levels. These findings suggest that the MHC class I promoter remains poised and accessible to rapidly respond to infection and environmental cues.


Figures

FIG. 1.
FIG. 1.
PD1 expression varies widely in different tissues and can be induced by IFN-γ in the spleens, kidneys, and brains of transgenic mice. (A) Northern blot of RNA from tissues from B10.PD1 transgenic mice. The numbers at the bottom represent relative amounts. (B) Induction of PD1 transcript levels in the spleen, kidney, and brain by in vivo treatment with IFN-γ as assessed by Northern blotting. GAPDH RNA levels served as the internal control.
FIG. 2.
FIG. 2.
Nucleosome occupancy across the MHC class I regulatory region does not correlate with either tissue-specific or induced levels of expression, except immediately downstream of transcription initiation. The top panel panel shows nucleosome occupancy in mock-treated spleen (⋄), IFN-γ-treated spleen (♦), mock-treated kidney (▵), IFN-γ-treated kidney (▴), mock-treated brain (□), and IFN-γ-treated brain (▪). The bottom panel presents the MHC class I upstream regulatory region, showing amplified regions (horizontal lines), important regulatory elements (▪), and exons (▒). The results are an average of two independent experiments. Error bars represent the standard errors of the mean. The lines drawn connecting data points do not necessarily imply levels between points.
FIG. 3.
FIG. 3.
Nucleosomes occupy multiple positions at the 5′ end of the MHC class I gene in all tissues studied, and these did not change on induction of the gene with IFN-γ. (A) Locations of primer sets used for fine-mapping nucleosome positions at the MHC class I promoter using LMPCR. The MHC class I upstream region is shown with important regulatory elements (▪), exon 1 (▒), and hypothetical nucleosome positions (oval areas bordered by dashed lines). (B) Lanes 1, 3, and 5, LMPCR products from mock-treated spleen, kidney, and brain, respectively, using primer set I that maps the downstream edge of nucleosome(s) roughly from positions −110 to −25. Lanes 2, 4, and 6, LMPCR products from IFN-γ-treated spleen, kidney, and brain, respectively. Lanes 7 and 8, LMPCR products from MNase-digested genomic DNA from B10.PD1 and B6 mice, respectively. The pattern of bands obtained has been reproduced in four independent experiments. A map of the PD1 5′ end and the position with respect to TSS are shown on the left. The densitometric scans of the LMPCR results from mock-treated (red line) and IFN-γ-treated (black line) spleen, kidney, and brain are shown on the right. (C) Same as panel B, except using primer set II that maps the downstream edge of nucleosome(s) roughly from positions −230 to −80. (D) Same as panel B, except using primer set V that maps the upstream edge of nucleosome(s) roughly from positions +45 to +125. Note that because it was not possible to internally control for loading differences on the gels, no quantitative comparison between lanes could be made.
FIG. 4.
FIG. 4.
The pattern of nucleosome occupancy and positioning across the MHC class I gene does not depend on active transcription. (A) MHC class I transcription is abrogated in splenocytes cultured for 5 h in medium containing 50 μg of α-amanitin/ml. The inset shows MHC class I transcript levels obtained using a nuclear run-on assay. (B) The top panel shows nucleosome occupancy in splenocytes incubated in medium alone (⋄) or in medium with 50 μg of α-amanitin/ml (⧫). The bottom panel shows the MHC class I upstream regulatory region indicating amplified regions (horizontal lines), important regulatory elements (▪), and exons (▒). The results are an average of two independent experiments. Error bars represent the standard errors of mean. The lines drawn connecting data points do not necessarily imply levels between points. (C) Lanes 1 and 2, LMPCR products from splenocytes incubated in medium alone or in medium containing 50 μg of α-amanitin/ml, respectively, using primer set I that maps the downstream edge of nucleosome(s) roughly from positions −110 to −25. The pattern of bands obtained has been reproduced in two independent experiments. A map of the PD1 5′ end and the position with respect to TSS are shown on the left. Densitometric scans of LMPCR results are shown on the right (medium, red line; α-amanitin, black line). (D) Same as panel C, except using primer set V that maps the upstream edge of nucleosome(s) roughly from positions +45 to +125.
FIG. 5.
FIG. 5.
MNase hypersensitivity correlates with expression level in tissues but does not change with induction or depend on active transcription. (A) Map of the PD1 gene in B10.PD1 transgenic mice. The regions examined for nuclease-hypersensitive regions are indicated by horizontal lines. The labeled HindIII/SacI probe is represented by a dotted line with an asterisk at the bottom of the figure. Its location shows where it hybridizes to the PD1 gene. (B to D) Southern blots with MNase-treated and HindIII/SacI-digested samples from untreated (B) and mock- and IFN-γ-treated spleen, kidney, and brain (C) or from splenocytes cultured in medium alone or medium with α-amanitin (D) probed with a fragment corresponding to the 1.4-kb PD1 5′ region are presented. Fragment sizes corresponding to the band are marked on the left. At the bottom of panel B, arrows indicate the positions of MNase-hypersensitive sites at the 5′ end of the PD1 gene, and the numbers on top of the arrows represent sizes of the bands (in kilobases) generated as a result of MNase hypersensitivity. Note that the MNase concentration was standardized to optimize the cleavage of the 1.4-kb fragment and the generation of its derivative 1.0-kb hypersensitive band. These conditions of MNase result in greater digestion of the 3.2-kb fragment (upstream copy of the gene). Due to the decreased MNase hypersensitivity in the kidney and brain, the weaker hypersensitive bands derived from the 3.2-kb fragment are not always visible.
FIG. 6.
FIG. 6.
Histone modifications positively associated with transcription (H3K9/K14 acetylation [A] and H3K4 trimethylation [B]) are higher at the PD1 gene in highly expressing spleen cells than in lower expressing kidney or brain cells. On the other hand, kidney and brain have higher levels of a histone modification negatively associated with transcription (H3K9 trimethylation [C]). In contrast, H2A.Z occupancy (D) showed a unique tissue-specific pattern, where the kidney had the highest levels of H2A.Z, followed by the spleen, whereas the brain had very low levels of H2A.Z. Panels A to D show the percentage of bound versus input in mock-treated spleen (⋄), IFN-γ-treated spleen (⧫), mock-treated kidney (▵), IFN-γ-treated kidney (▴), mock-treated brain (□), and IFN-γ-treated brain (▪). The bottom panel shows the MHC class I gene with amplified regions (horizontal lines), important regulatory elements (▪), and exons (▒). The results are an average of two independent experiments. Error bars represent the standard errors of mean. Input is the entire mononucleosomal fraction before immunoprecipitation, and hence the results obtained are normalized to nucleosome occupancy. The lines drawn connecting data points do not necessarily imply levels between points.

Similar articles

Cited by

References

    1. Albert, I., T. N. Mavrich, L. P. Tomsho, J. Qi, S. J. Zanton, S. C. Schuster, and B. F. Pugh. 2007. Translational and rotational settings of H2A.Z nucleosomes across the Saccharomyces cerevisiae genome. Nature 446572-576. - PubMed
    1. Baldwin, A. S., Jr., and P. A. Sharp. 1987. Binding of a nuclear factor to a regulatory sequence in the promoter of the mouse H-2Kb class I major histocompatibility gene. Mol. Cell. Biol. 7305-313. - PMC - PubMed
    1. Banerji, S. S., N. G. Theodorakis, and R. I. Morimoto. 1984. Heat shock-induced translational control of HSP70 and globin synthesis in chicken reticulocytes. Mol. Cell. Biol. 42437-2448. - PMC - PubMed
    1. Berger, S. L. 2007. The complex language of chromatin regulation during transcription. Nature 447407-412. - PubMed
    1. Bernstein, B. E., C. L. Liu, E. L. Humphrey, E. O. Perlstein, and S. L. Schreiber. 2004. Global nucleosome occupancy in yeast. Genome Biol. 5R62. - PMC - PubMed

Publication types

MeSH terms