. 2008 Dec 15;112(13):4874-83.
doi: 10.1182/blood-2008-05-155374. Epub 2008 Sep 22.

Characterization and quantification of clonal heterogeneity among hematopoietic stem cells: a model-based approach

Affiliations

Characterization and quantification of clonal heterogeneity among hematopoietic stem cells: a model-based approach

Ingo Roeder et al. Blood. .

Abstract

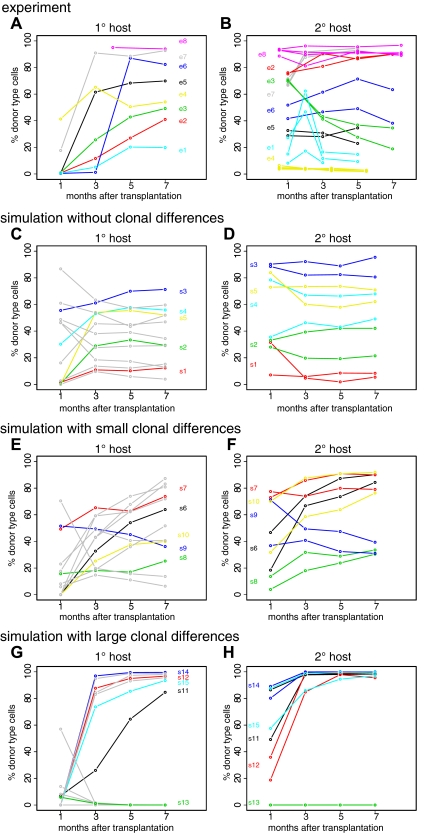
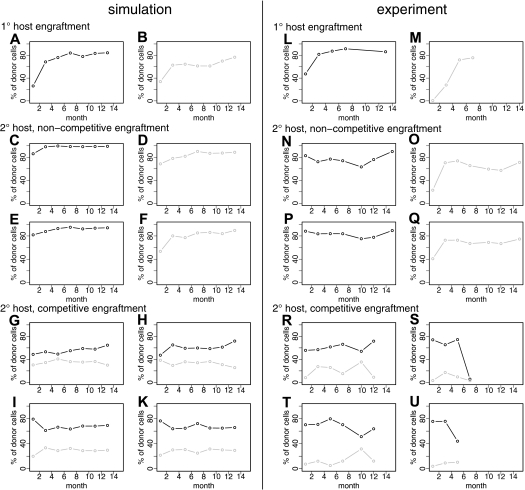
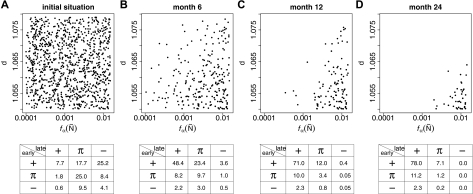
Hematopoietic stem cells (HSCs) show pronounced heterogeneity in self-renewal and differentiation behavior, which is reflected in their repopulation kinetics. Here, a single-cell-based mathematical model of HSC organization is used to examine the basis of HSC heterogeneity. Our modeling results, which are based on the analysis of limiting dilution competitive repopulation experiments in mice, demonstrate that small quantitative but clonally fixed differences of cellular properties are necessary and sufficient to account for the observed functional heterogeneity. The model predicts, and experimental data validate, that competitive pressures will amplify small clonal differences into large changes in the number of differentiated progeny. We further predict that the repertoire of HSC clones will evolve over time. Last, our results suggest that larger differences in cellular properties have to be assumed to account for genetically determined differences in HSC behavior as observed in different inbred mice strains. The model provides comprehensive systemic and quantitative insights into the clonal heterogeneity among HSCs with potential applications in predicting the behavior of malignant and/or genetically modified cells.


Figures

Figure 1
Figure 1
Experimentally observed and simulated engraftment kinetics in primary and secondary recipients. (A) The graphic illustrates experimentally observed engraftment kinetics, as determined in the peripheral blood (PB), generated by different, clonally derived transplants in primary hosts (different colors indicate different clones). At month 7, HSCs from these primary hosts were transplanted into secondary hosts. (B) Experimentally observed engraftment kinetics in the PB of secondary hosts. Corresponding colors were used to indicate the relationship of primary HSCs and its clonal progeny revealed in multiple secondary hosts. Data in panels A and B are taken from Muller-Sieburg et al. (C,D) Representative examples of simulated engraftment kinetics in primary (C) and secondary (D) host assuming no predetermined differences of individual clones. Identical color codes indicate identical clonal origin in primary and secondary recipients. Gray lines give more examples of primary kinetics to better illustrate the distribution. They are not shown in secondary hosts. (E,F) See panels C and D, but this time assuming small differences between individual HSCs with respect to parameter d. d has been randomly sampled from a normal distribution with mean 1.07 (reference value) and standard deviation 0.01. The particular d values for the given example realizations are 1.06052 (black), 1.06501 (red), 1.06624 (yellow), 1.06708 (green), and 1.07337 (blue). (G,H) See panels C and D but with large differences in parameter d. d has been randomly sampled from the 2 intervals [1.038, 1.049] and [1.091, 1.102], which relate to deviations of plus or minus 2% to 3% from the reference value 1.07. The particular d values for the given example realizations are 1.04705 (black), 1.04392 (red), 1.09377 (green), 1.02802 (blue), and 1.04761 (light blue). To facilitate the comparison with the experimental data, simulated engraftment levels are shown on a bimonthly scale, although they were actually simulated using a 1-hourly scale.
Figure 2
Figure 2
Experimentally and simulated distributions of engraftment levels and trends. (A) Distributions of engraftment levels at 7 months after transplantation in primary hosts. (B,C) Distributions of engraftment trends (ie, differences in engraftment levels between month 3 and month 7 after transplantation) in primary (B) and secondary (C) hosts. According to the number of experimentally determined engraftment kinetics, we simulated the repopulation of n = 87 primary host and 8 pairs (n = 16) of secondary hosts. Boxplots show the median (black line), the interquartile range (box), and the total range (whiskers, or circles in case of “outliers,” ie, data points that deviate from the median more than 1.5 times the box range). P values are given for the Bartlett test of equality of variances.
Figure 3
Figure 3
Qualitative classification of individual engraftment kinetics. (A) Shown are 87 previously published repopulation kinetics of mice transplanted with clonally derived HSC grafts obtained by in vitro or in vivo limiting dilution. Shaded areas illustrate early (light) and late (dark) repopulation phases. Whereas +/− indicate an increase or decrease in the engraftment levels of more than 10% between the first and the last measurement in the given period, π refers to a constant (ie, change of less than 10%) time progression. (B) Shown are 87 representative simulated engraftment kinetics according to the given classification scheme. Underlying model parameters d and fα(Ñ) are randomly sampled from the best-fit region shown in Figure 4B.
Figure 4
Figure 4
In silico engraftment kinetics depending on model parameters of donor HSCs. (A) Graphic representation of the qualitative differences of simulated engraftment kinetics depending on the choice of model parameters d and fα(Ñ). Each individual color dot illustrates the qualitative pattern of the engraftment kinetic observed in a simulation using the particular parameter combination. In total, 55 074 different parameter combinations are shown in the figure. Simulations were initiated with one donor cell with the particular d and fα(Ñ) values (according to the position in the diagram) and 4 competing host cells with reference parameters d = 1.07 and fa(Ñ) = 0.01. All other parameters had been fixed to B6 reference values, identically for donor and host cells. (B) Parameter region (depicted as white square in panel A; comprising 11 682 simulation runs) that yields the best fit of the simulated to the experimentally observed distribution of engraftment kinetics (compare with Figure S2). The 2 black lines indicate the reference values for d and fa(Ñ) used for the competing host cells. Color coding for engraftment kinetics (identical in panels A and B): maroon [+, +], red [+, π], pink [π, +], dark green [−, −], medium green [−, π], light green [π, −], purple [π,π], blue [+, −], yellow [−, +], and black (no donor engraftment).
Figure 5
Figure 5
Simulation results and experimental data on individual clone competition. (A,B) Simulated primary host engraftments of 2 clones with slightly differing parameters: (A) d = 1.0655, fα(Ñ) = 0.0075; (B) d = 1.0665, fα(Ñ) = 0.008. (C,E) 2 representative examples of secondary engraftments of the clone shown in panel A (ie, in silico transplantation of 50 ×p1 primary HSCs together with 4 residual secondary host HSCs). p is denoting the proportion of primary engraftment level, which is p1 = 0.85 in this particular example. (D,F) See panels C and E, but for the clone shown in panel B, p2 = 0.75. (G-K) A total of 4 representative examples of in silico cotransplantation of 50 × p1 cells of the clone shown in panel A plus 50 × p2 cells of the clone shown in panel B together with 4 residual secondary host cells. Further simulation examples of these settings can be found in Figure S4. (L,M) Experimentally observed engraftment kinetics (twice-monthly measurements) of 2 clonally repopulated mice. (N-Q) Engraftment kinetics for the transplantation of 5 × 10⁶ BM cells of either one or the other clone (shown in panels L and M, respectively) in 2 lethally irradiated secondary B6 hosts. (R-U) Engraftment kinetics for cotransplantation of 2 × (5 × 106) BM cells from both primary hosts into 4 lethally irradiated secondary B6 hosts (Cho et al). Color (black/gray) always illustrates relationship to primary host.
Figure 6
Figure 6
Simulation results on clonal conversion during aging. Given is the clone distribution (characterized by clone specific d / fα(Ñ) values) within a model system starting from the initial situation (A) at different time points: 6 months (B), 12 months (C), and 24 months (C). The system had been initiated with 1000 clonally distinguishable HSCs. Each dot in the graphs (A-D) represents one particular clone. The corresponding frequency tables show the distributions of engraftment patterns obtained from 10 000 simulations, each initiated by the transplantation of 1 randomly chosen cell from the given stem cell pool in competition with 4 host cells.

Similar articles

Cited by

References

    1. Devine H, DeMeyer E. Hematopoietic cell transplantation in the treatment of leukemia. Semin Oncol Nurs. 2003;19:118–132. - PubMed
    1. Klein C, Baum C. Gene therapy for inherited disorders of haematopoietic cells. Hematol J. 2004;5:103–111. - PubMed
    1. Habibian HK, Peters SO, Hsieh CC, et al. The fluctuating phenotype of the lymphohematopoietic stem cell with cell cycle transit. J Exp Med. 1998;188:393–398. - PMC - PubMed
    1. Quesenberry P, Habibian H, Dooner M, et al. Physical and physiological plasticity of hematopoietic stem cells. Blood Cell Mol Dis. 2001;27:934–937. - PubMed
    1. Down JD, Boudewijn A, Os Rv Thames HD, Ploemacher RE. Variations in radiation sensitivity and repair among different hematopoietic stem cell subsets following fractionated irradiation. Blood. 1995;86:122–127. - PubMed

Publication types