. 2008 Oct 7;105(40):15558-63.
doi: 10.1073/pnas.0807419105. Epub 2008 Sep 22.

CD4+ T cells support glial neuroprotection, slow disease progression, and modify glial morphology in an animal model of inherited ALS

Affiliations

CD4+ T cells support glial neuroprotection, slow disease progression, and modify glial morphology in an animal model of inherited ALS

David R Beers et al. Proc Natl Acad Sci U S A. .

Abstract

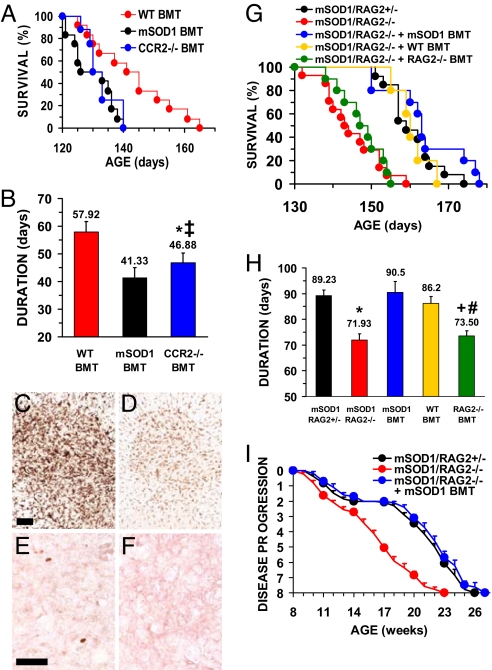
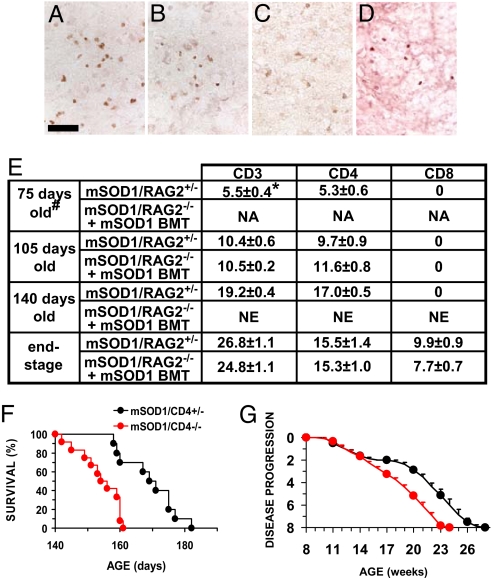
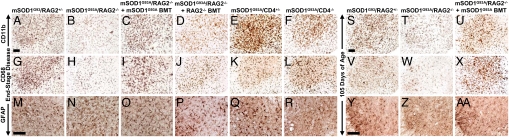
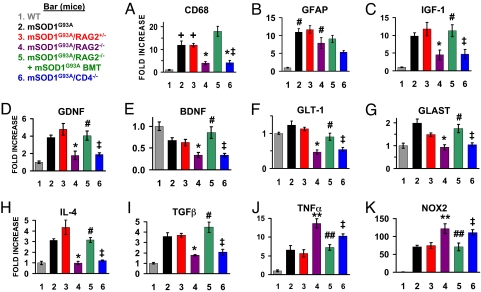
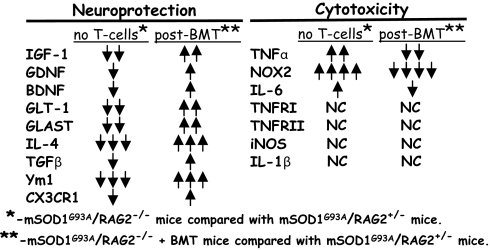
Neuroinflammation, marked by gliosis and infiltrating T cells, is a prominent pathological feature in diverse models of dominantly inherited neurodegenerative diseases. Recent evidence derived from transgenic mice ubiquitously overexpressing mutant Cu(2+)/Zn(2+) superoxide dismutase (mSOD1), a chronic neurodegenerative model of inherited amyotrophic lateral sclerosis (ALS), indicates that glia with either a lack of or reduction in mSOD1 expression enhance motoneuron protection and slow disease progression. However, the contribution of T cells that are present at sites of motoneuron injury in mSOD1 transgenic mice is not known. Here we show that when mSOD1 mice were bred with mice lacking functional T cells or CD4+ T cells, motoneuron disease was accelerated, accompanied by unexpected attenuated morphological markers of gliosis, increased mRNA levels for proinflammatory cytokines and NOX2, and decreased levels of trophic factors and glial glutamate transporters. Bone marrow transplants reconstituted mice with T cells, prolonged survival, suppressed cytotoxicity, and restored glial activation. These results demonstrate for the first time in a model of chronic neurodegeneration that morphological activation of microglia and astroglia does not predict glial function, and that the presence of CD4+ T cells provides supportive neuroprotection by modulating the trophic/cytotoxic balance of glia. These glial/T-cell interactions establish a novel target for therapeutic intervention in ALS and possibly other neurodegenerative diseases.


Conflict of interest statement

The authors declare no conflict of interest.

Figures

Fig. 1.
Fig. 1.
T cells prolong survival. (A) mSOD1G93A/PU.1−/− mice on a B6/SJL genetic background receiving CCR2−/− BMT have a shorter survival time (133 ± 2 days, n = 10) than mSOD1G93A/PU.1−/− mice after WT BMT (141 ± 3 days, n = 12), and were similar to mSOD1G93A/PU.1+/− littermates (133 ± 2 days, n = 12; data not shown for clarity) and mSOD1G93A/PU.1−/− mice with mSOD1G93A BMT (130 ± 2 days, n = 12). (B) Disease duration was attenuated in mSOD1G93A/PU.1−/− mice receiving CCR2−/− BMT. Data for mSOD1G93A/PU.1+/− mice were eliminated for clarity but were similar to mSOD1G93A/PU.1−/− mice with mSOD1G93A BMT (P = 0.55). (C) CD11b immunohistochemistry of morphologically activated microglia at end-stage disease in mSOD1G93A/PU.1+/− mice. (D) Following BMT with CCR2−/− donor-derived cells, the CD11b signal from microglia of mSOD1G93A/PU.1−/− was reduced. (E) CD3+ T cells were observed in mSOD1G93A/PU.1+/− mice. (F) CD3+ T cells were absent in mSOD1G93A/PU.1−/− mice receiving CCR2−/− BMT. (G) Survival times were shorter in mSOD1G93A/RAG2−/− mice, on a C57BL/6 genetic background, lacking functional T and B cells (145 ± 2 days, n = 14) than in mSOD1G93A/RAG2+/− littermates (161 ± 2 days, n = 13), but were prolonged following BMT (mSOD1G93A: 164 ± 3 days, n = 10; WT: 161 ± 2 days, n = 10). RAG2−/− BMT did not increase survival (148 ± 2 days, n = 10). Survival of mSOD1G93A/RAG2+/− mice were similar to mSOD1G93A/RAG2+/+ (160 ± 3 days, n = 20, P = 0.61). (H) Disease duration was shorter in mSOD1G93A/RAG2−/− mice than mSOD1G93A/RAG2+/− littermates, but was prolonged following BMT. (I) Disease progression in mSOD1G93A/RAG2−/− mice lacked the 4-week plateau of mSOD1G93A/RAG2+/− mice and was re-established after mSOD1G93A BMT. *, Not different from mSOD1G93A/PU.1−/− mice with mSOD1G93A BMT; different from mSOD1G93A/PU.1−/− mice with WT BMT; +different from mSODG93A/RAG2+/−; #, not different from mSODG93A/RAG2−/−. (Scale bars: C and D, 100 μm; E and F, 50 μm.)
Fig. 2.
Fig. 2.
Immunohistochemical evaluations revealed the presence of T cells. CD3+ T cells were documented at end-stage disease in mSOD1G93A/RAG2+/− mice (A) and were observed in mSOD1G93A/RAG2−/− mice following mSOD1G93A BMT (B). Similar results were obtained using antibodies to CD4 (C). Only CD8+ T cells were observed in mSOD1G93A/CD4−/− mice (D). Numbers and subpopulations of T cells in lumbar spinal cords (E). mSOD1G93A/CD4+/− mice survived longer (170 ± 3 days, n = 10) than mSOD1G93A/CD4−/− mice (154 ± 2 days, n = 12), both on C57BL/6 genetic backgrounds (F). There was a 4-week plateau in mSOD1G93A/CD4+/− mice that was absent in mSOD1G93A/CD4−/− mice (G). #, n = 3 for each time point. *, Mean number of cells per 30-μm section ± SEM. NA, not appropriate (just after BMT); NE, not examined. (Scale bar: 50 μm.)
Fig. 3.
Fig. 3.
Immunohistochemical evaluations of lumbar spinal cord. The CD11b microglial/macrophage signal observed at end-stage disease in lumbar spinal cord sections of mSOD1G93A/RAG2+/− mice (A) was decreased in mSOD1G93A/RAG2−/− mice (B) and restored after mSOD1G93A BMT (C). CD11b signal was not restored after RAG2−/− BMT (D). As with mSOD1G93A/RAG2−/− mice, the CD11b immunoreactivity observed at end-stage disease in mSOD1G93A/CD4+/− mice (E) was reduced in mSOD1G93A/CD4−/− mice (F). Similar results were observed with antibodies to CD68 (G–L), which was consistent with the quantitative RT-PCR results. GFAP immunoreactivity was not different between groups at end-stage disease (M–O) and was unchanged after RAG2−/− BMT (P). The GFAP signal observed in mSOD1G93A/CD4+/− mice (Q) was less in mSOD1G93A/CD4−/− mice (R). Compared with that observed with CD11b staining of mSOD1G93A/RAG2+/− mice at 105 days of age (S), microglial activation was less in mSOD1G93A/RAG2−/− mice at the same age (T) and again restored following mSOD1G93A BMT (U). Similar results were observed with CD68 at 105 days of age (V–X). Compared with mSOD1G93A/RAG2+/− mice at 105 days of age (Y), astrocyte activation was reduced in mSOD1G93A/RAG2−/− mice at 105 days of age (Z) and restored after mSOD1G93A BMT (AA). (Scale bars: A–L and S–X, 100 μm; M–R and Y–AA, 100 μm.)
Fig. 4.
Fig. 4.
Quantitative RT-PCR results (note the different ordinate for each graph). Normalized to β-actin. For all groups of mice, n = 3. (A) Quantitative RT-PCR determined that the mRNA level for CD68 is reduced in mSOD1G93A/RAG2−/− mice and restored after mSOD1G93A BMT. The mSOD1G93A/CD4−/− mice also had reduced levels of CD68. These results are consistent with the immunohistochemical observations. (B) The mRNA level for GFAP was increased in all mSOD1G93A groups of mice. (C–E) There were reduced message levels for IGF-1, GDNF, and BDNF in mSOD1G93A/RAG2−/− mice compared with mSOD1G93A/RAG2+/− mice at end-stage disease, and the levels were restored after mSOD1G93A BMT. Message levels for these neurotrophic factors were also reduced in mSOD1G93A/CD4−/− mice. Similar results were obtained for GLT-1 (F) and GLAST (G), glutamate transporters predominately localized on astrocytes. (H) IL-4 was reduced in mSOD1G93A/RAG2−/− mice compared with mSOD1G93A/RAG2+/− mice, but was restored following mSOD1G93A BMT. mSOD1G93A/CD4−/− mice also had a reduced mRNA level for IL-4. (I) TGF-β, an anti-inflammatory/neurotrophic factor, was decreased in mSOD1G93A/RAG2−/− mice compared with mSOD1G93A/RAG2+/− mice but was again restored following mSOD1G93A BMT. (J) In contrast to IL-4 and TGF-β, the proinflammatory agent TNF-α was elevated in mSOD1G93A/RAG2−/− and mSOD1G93A/CD4−/− mice. (K) NOX2, a subunit in the enzyme responsible for the production of highly toxic superoxide molecules, was also elevated in mSOD1G93A/RAG2−/− and mSOD1G93A/CD4−/− mice. +Increased compared with WT mice, P < 0.05; *, decreased compared with mSOD1G93A or mSOD1G93A/RAG2+/− mice, P < 0.05; ‡, not different from mSOD1G93A/RAG2−/− mice; #, not different from mSOD1G93A/RAG2+/− mice; **, increased compared with mSOD1G93A or mSOD1G93A/RAG2+/− mice, P < 0.05; ##, decreased compared with mSOD1G93A/RAG2−/− mice, P < 0.05.
Fig. 5.
Fig. 5.
The presence of T cells shifts the balance of microglial and astroglial responses from reduced protection and increased cytotoxicity to increased neuroprotection and decreased toxicity following BMT. ↓↓↓>75% decrease; ↓↓50–75% decrease; ↓, 0–50% decrease; NC, no change; ↑, 100–500% increase; ↑↑, 600–1500% increase; and ↑↑↑, 1600–2500% increase; ↑↑↑↑, 2600–5000% increase.

Similar articles

Cited by

References

    1. Lobsiger CS, Cleveland DW. Glial cells as intrinsic components of non-cell-autonomous neurodegenerative disease. Nat Neurosci. 2007;10:1355–1360. - PMC - PubMed
    1. Rowland LP, Shneider NA. Amyotrophic lateral sclerosis. N Engl J Med. 2001;344:1688–1700. - PubMed
    1. Gurney M, et al. Motor neuron degeneration in mice that express a human Cu,Zn superoxide dismutase mutation. Science. 1994;264:1772–1775. - PubMed
    1. Boillée S, Vande Velde C, Cleveland DW. ALS: A disease of motor neurons and their nonneuronal neighbors. Neuron. 2006;52:39–59. - PubMed
    1. Yamanaka K, et al. Astrocytes as determinants of disease progression in inherited amyotrophic lateral sclerosis. Nat Neurosci. 2008;11:251–253. - PMC - PubMed

Publication types