. 2008 Sep 30;105(39):15142-7.
doi: 10.1073/pnas.0806486105. Epub 2008 Sep 22.

Disulfide locking a sodium channel voltage sensor reveals ion pair formation during activation

Affiliations

Disulfide locking a sodium channel voltage sensor reveals ion pair formation during activation

Paul G DeCaen et al. Proc Natl Acad Sci U S A. .

Abstract

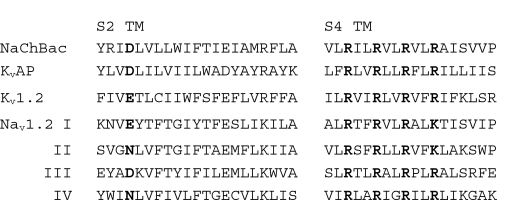
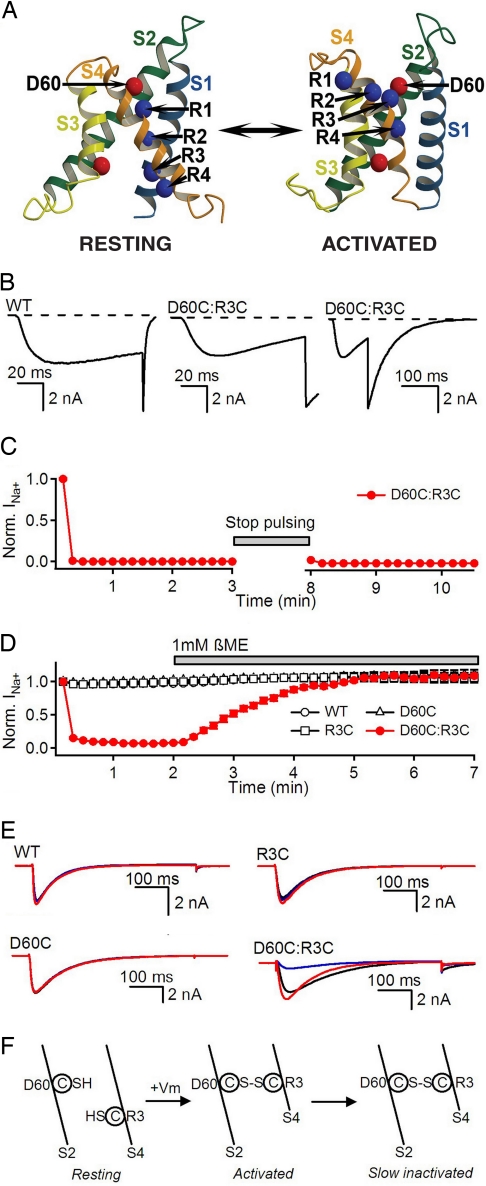
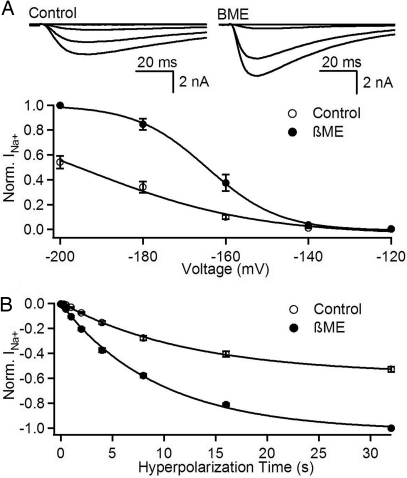
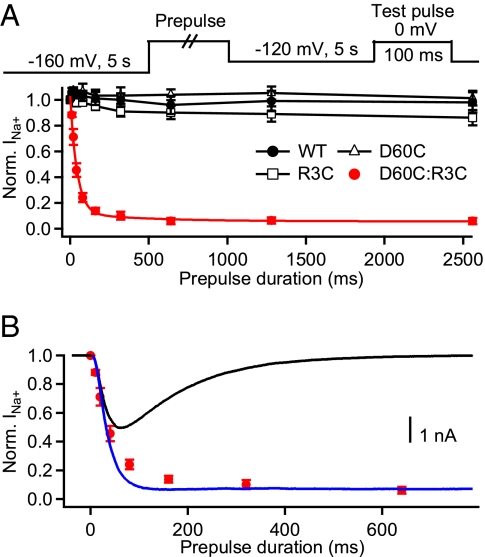
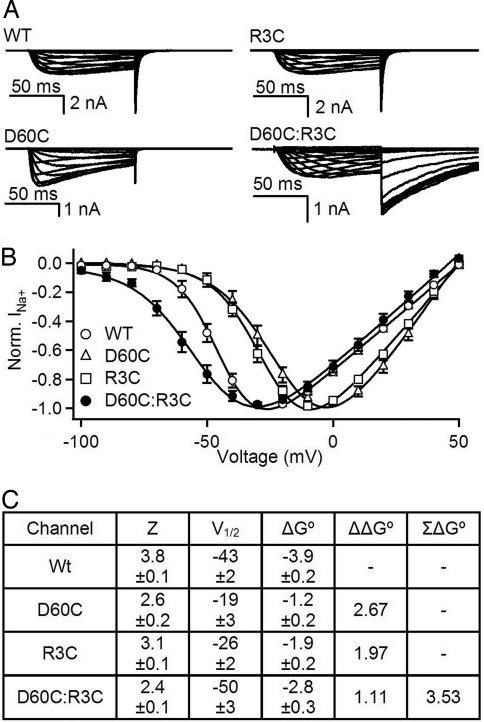
The S4 transmembrane segments of voltage-gated ion channels move outward on depolarization, initiating a conformational change that opens the pore, but the mechanism of S4 movement is unresolved. One structural model predicts sequential formation of ion pairs between the S4 gating charges and negative charges in neighboring S2 and S3 transmembrane segments during gating. Here, we show that paired cysteine substitutions for the third gating charge (R3) in S4 and D60 in S2 of the bacterial sodium channel NaChBac form a disulfide bond during activation, thus "locking" the S4 segment and inducing slow inactivation of the channel. Disulfide locking closely followed the kinetics and voltage dependence of activation and was reversed by hyperpolarization. Activation of D60C:R3C channels is favored compared with single cysteine mutants, and mutant cycle analysis revealed strong free-energy coupling between these residues, further supporting interaction of R3 and D60 during gating. Our results demonstrate voltage-dependent formation of an ion pair during activation of the voltage sensor in real time and suggest that this interaction catalyzes S4 movement and channel activation.


Conflict of interest statement

The authors declare no conflict of interest.

Figures

Scheme 1.
Scheme 1.
Positions of S2 and S4 gating charges are conserved in NaChBac
Fig. 1.
Fig. 1.
Disulfide locking and recovery of D60C:R3C. (A) Rosetta-Membrane model. View of the ribbon representation of the voltage-sensing module of NaChBac in the resting (Left) and activated (Right) states. Segments S1 through S4 are colored individually and labeled. Side chains of gating-charge-carrying arginines in S4 (labeled R1 through R4 and colored blue) and D60 and E70 in S2 (colored red) are represented as spheres. (B) NaChBac WT and D60C:R3C current traces elicited by depolarizations to 0 mV for 100 ms followed by return to the holding potential of −120 mV. (C) Mean normalized peak currents elicited by 0.1 Hz trains of 500-ms depolarizations to 0 mV from a holding potential of −140 mV in tsA-201 cells expressing NaChBac D60C:R3C channels (n = 7). After 3 min, the pulsing was stopped for 5 min to test for channel recovery. (D) Mean normalized peak currents elicited by a 0.1 Hz train of 500-ms depolarizations to 0 mV from a holding potential of −140 mV in tsA cells transfected with −201 WT D60C, R3C, or D60C:R3C channels (n = 8). After 2 min in the control saline conditions, cells were exposed to 1 mM βME. (E) Current traces from indicated NaChBac constructs from the experiment described in D. Black traces are from the first depolarizing pulse of the experiment (t = 0 min.). Blue traces are from the last pulse before exposure to βME (t = 2 min). Red traces are after 5 min of βME treatment (t = 7 min). (F) Scheme representing the proposed state-dependent interaction of the cysteine residues followed by slow inactivation.
Fig. 2.
Fig. 2.
Reversal of disulfide locking by hyperpolarization and βME. (A) Voltage-dependence of reversal of disulfide locking. (Top) Families of D60C:R3C currents elicited by 100-ms depolarizations to 0 mV after 5-s hyperpolarizing pulses ranging from −200 mV to −120 mV in control and in the presence of 1 mM βME (n = 8). Before each trial, channels were subjected to five 500-ms pulses to 0 mV to disulfide-lock and fully inactivate all voltage sensors (data not shown). (Bottom) For each cell, peak currents were normalized to the largest peak current in the presence of βME. Mean normalized peak currents were replotted against the potential of the hyperpolarizing prepulse. (B) Time dependence of reversal of disulfide locking. Fully locked and inactivated D60C:R3C channels (see above) were hyperpolarized to −160 mV for the indicated times followed by a 100-ms test pulse to 0 mV in control conditions or in the presence of 1 mM βME. (n = 7). For each cell, peak test pulse currents were normalized to the peak current after the 32-s hyperpolarization in the presence of βME. Mean normalized peak currents (±SEM) are plotted against prepulse duration.
Fig. 3.
Fig. 3.
Time course of voltage-sensor locking. (A) Rate of prepulse-dependent inactivation of D60C:R3C channels. D60C:R3C channels were first unlocked by a 5-s prepulse to −160 mV. Cells were then depolarized for the indicated times to ≈V1/2 + 20 mV (WT, −20 mV; D60C and R3C, 0 mV; and D60C:R3C, −30 mV), returned to −120 mV for 5 s, and depolarized 100-ms test pulse to 0 mV. Peak test pulse current at 0 mV was normalized to the control with a test pulse current in the absence of a prepulse, and mean (±SEM) was plotted versus prepulse duration (n = 6). (B) Comparison of the rates of disulfide locking and activation. Sodium current recorded during a −30 mV prepulse (black curve). The time course of activation in the absence of inactivation (blue trace) was estimated by fitting an exponential to the current decay and adding the inactivated component back to the total current. This time course of activation is compared with the rate of loss of test pulse current (red circles) from A.
Fig. 4.
Fig. 4.
Mutant cycle analysis of coupling between NaChBac D60C and R3C mutations. (A) Families of sodium current traces from each of the indicated NaChBac channels activated by 100-ms depolarizations to potentials ranging from −120 mV to −50 mV in 10 mV increments from a holding potential of −160 mV. (B) Normalized peak currents during depolarizations to the indicated potentials (n = 10; ±SEM). (C) Mutant cycle analysis. Estimated values for Z and V1/2 in mV, ΔG°, ΔΔG°, and ΣΔG° in kcal/mol obtained by fitting the I/V relationships for the WT and mutant NaChBac channels are presented (see Materials and Methods).

References

    1. Hodgkin AL, Huxley AF. A quantitative description of membrane current and its application to conduction and excitation in nerve. J Physiol. 1952;117:500–544. - PMC - PubMed
    1. Armstrong CM, Bezanilla F. Currents related to movement of the gating particles of the sodium channels. Nature. 1973;242:459–461. - PubMed
    1. Keynes RD, Rojas E. Kinetics and steady-state properties of the charged system controlling sodium conductance in the squid giant axon. J Physiol. 1974;239:393–434. - PMC - PubMed
    1. Seoh SA, Sigg D, Papazian DM, Bezanilla F. Voltage-sensing residues in the S2 and S4 segments of the Shaker K+ channel. Neuron. 1996;16:1159–1167. - PubMed
    1. Tombola F, Pathak MM, Isacoff EY. How does voltage open an ion channel? Annu Rev Cell Dev Biol. 2006;22:23–52. - PubMed

Publication types

LinkOut - more resources