

Comparison study on k-word statistical measures for protein: from sequence to 'sequence space'
- PMID: 18811946
- PMCID: PMC2571980
- DOI: 10.1186/1471-2105-9-394
Comparison study on k-word statistical measures for protein: from sequence to 'sequence space'
Abstract
Background: Many proposed statistical measures can efficiently compare protein sequence to further infer protein structure, function and evolutionary information. They share the same idea of using k-word frequencies of protein sequences. Given a protein sequence, the information on its related protein sequences hasn't been used for protein sequence comparison until now. This paper proposed a scheme to construct protein 'sequence space' which was associated with protein sequences related to the given protein, and the performances of statistical measures were compared when they explored the information on protein 'sequence space' or not. This paper also presented two statistical measures for protein: gre.k (generalized relative entropy) and gsm.k (gapped similarity measure).
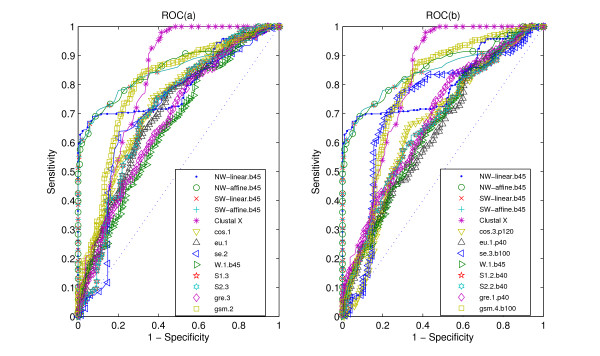
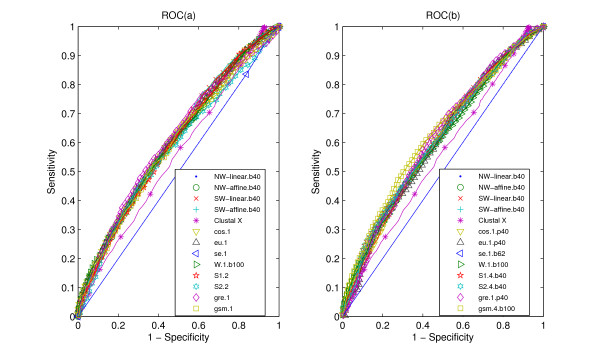
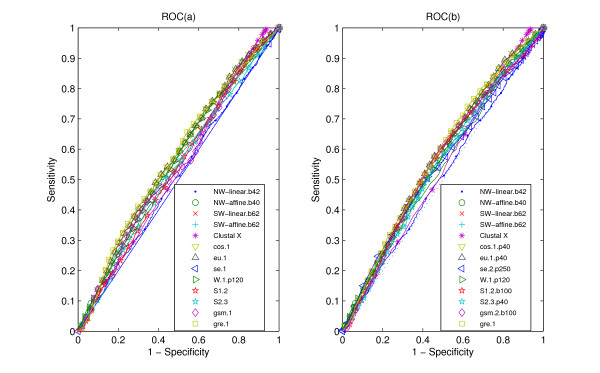
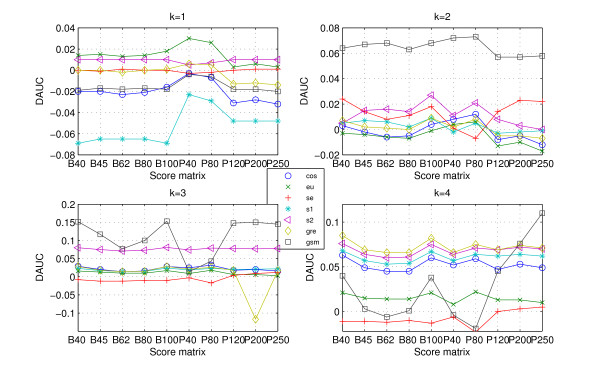
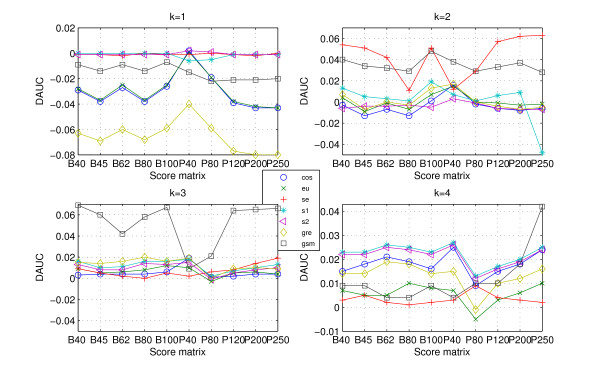
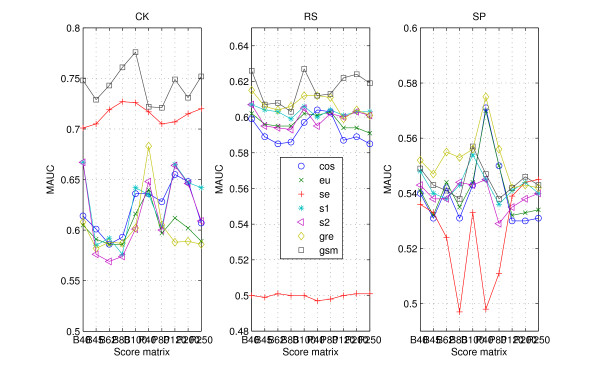
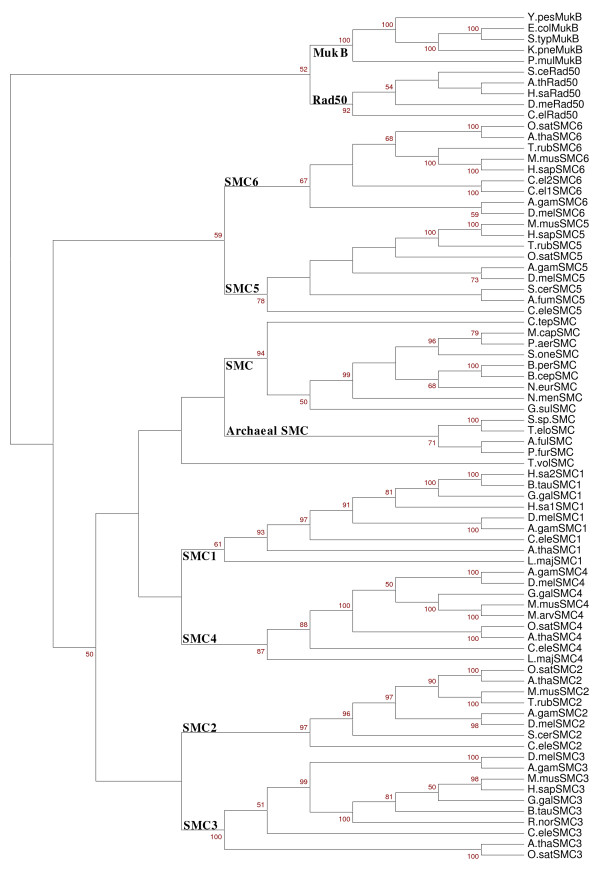
Results: We tested statistical measures based on protein 'sequence space' or not with three data sets. This not only offers the systematic and quantitative experimental assessment of these statistical measures, but also naturally complements the available comparison of statistical measures based on protein sequence. Moreover, we compared our statistical measures with alignment-based measures and the existing statistical measures. The experiments were grouped into two sets. The first one, performed via ROC (Receiver Operating Curve) analysis, aims at assessing the intrinsic ability of the statistical measures to discriminate and classify protein sequences. The second set of the experiments aims at assessing how well our measure does in phylogenetic analysis. Based on the experiments, several conclusions can be drawn and, from them, novel valuable guidelines for the use of protein 'sequence space' and statistical measures were obtained.
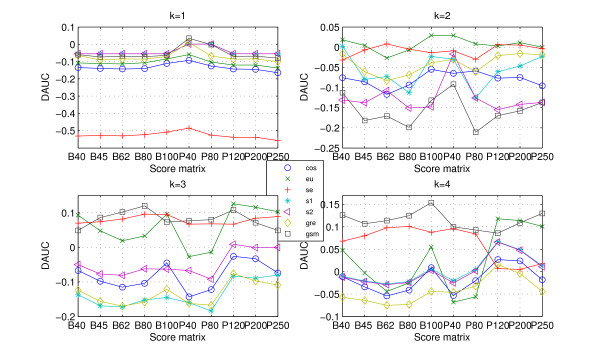
Conclusion: Alignment-based measures have a clear advantage when the data is high redundant. The more efficient statistical measure is the novel gsm.k introduced by this article, the cos.k followed. When the data becomes less redundant, gre.k proposed by us achieves a better performance, but all the other measures perform poorly on classification tasks. Almost all the statistical measures achieve improvement by exploring the information on 'sequence space' as word's length increases, especially for less redundant data. The reasonable results of phylogenetic analysis confirm that Gdis.k based on 'sequence space' is a reliable measure for phylogenetic analysis. In summary, our quantitative analysis verifies that exploring the information on 'sequence space' is a promising way to improve the abilities of statistical measures for protein comparison.
Figures
Similar articles
-
Markov model plus k-word distributions: a synergy that produces novel statistical measures for sequence comparison.Bioinformatics. 2008 Oct 15;24(20):2296-302. doi: 10.1093/bioinformatics/btn436. Epub 2008 Aug 18. Bioinformatics. 2008. PMID: 18710871
-
Compression-based classification of biological sequences and structures via the Universal Similarity Metric: experimental assessment.BMC Bioinformatics. 2007 Jul 13;8:252. doi: 10.1186/1471-2105-8-252. BMC Bioinformatics. 2007. PMID: 17629909 Free PMC article.
-
On the quality of tree-based protein classification.Bioinformatics. 2005 May 1;21(9):1876-90. doi: 10.1093/bioinformatics/bti244. Epub 2005 Jan 12. Bioinformatics. 2005. PMID: 15647305
-
The limits of protein sequence comparison?Curr Opin Struct Biol. 2005 Jun;15(3):254-60. doi: 10.1016/j.sbi.2005.05.005. Curr Opin Struct Biol. 2005. PMID: 15919194 Free PMC article. Review.
-
The Human Cell Atlas: making 'cell space' for disease.Dis Model Mech. 2019 Feb 1;12(2):dmm037622. doi: 10.1242/dmm.037622. Dis Model Mech. 2019. PMID: 30642873 Free PMC article. Review.
Cited by
-
Comparison study on statistical features of predicted secondary structures for protein structural class prediction: From content to position.BMC Bioinformatics. 2013 May 4;14:152. doi: 10.1186/1471-2105-14-152. BMC Bioinformatics. 2013. PMID: 23641706 Free PMC article.
-
Alignment-free Transcriptomic and Metatranscriptomic Comparison Using Sequencing Signatures with Variable Length Markov Chains.Sci Rep. 2016 Nov 23;6:37243. doi: 10.1038/srep37243. Sci Rep. 2016. PMID: 27876823 Free PMC article.
-
A Markovian analysis of bacterial genome sequence constraints.PeerJ. 2013 Aug 29;1:e127. doi: 10.7717/peerj.127. eCollection 2013. PeerJ. 2013. PMID: 24010012 Free PMC article.
-
Assembly-free genome comparison based on next-generation sequencing reads and variable length patterns.BMC Bioinformatics. 2014;15 Suppl 9(Suppl 9):S1. doi: 10.1186/1471-2105-15-S9-S1. Epub 2014 Sep 10. BMC Bioinformatics. 2014. PMID: 25252700 Free PMC article.
-
Comparison of metatranscriptomic samples based on k-tuple frequencies.PLoS One. 2014 Jan 2;9(1):e84348. doi: 10.1371/journal.pone.0084348. eCollection 2014. PLoS One. 2014. PMID: 24392128 Free PMC article.
References
-
- Wu CH, Huang H, Arminski L, Castro-Alvear J, Chen Y, Hu ZZ, Ledley RS, Lewis KG, Mewes HW, Orcutt BC, Suzek BE, Tsugita A, Vinayaka CR, Yeh LSL, Zhang J, Barker WC. The Protein Information Resource, an integrated public resource of functional annotation of proteins. Nucleic Acids Res. 2002;30:35–37. - PMC - PubMed
-
- Altschul SF, Gish W, Miller W, Myers EW, Lipman DJ. Basic local alignment search tool. J Mol Biol. 1990;215:403–410. - PubMed
MeSH terms
Substances
LinkOut - more resources
Full Text Sources
