

The rules of gene expression in plants: organ identity and gene body methylation are key factors for regulation of gene expression in Arabidopsis thaliana
- PMID: 18811951
- PMCID: PMC2566314
- DOI: 10.1186/1471-2164-9-438
The rules of gene expression in plants: organ identity and gene body methylation are key factors for regulation of gene expression in Arabidopsis thaliana
Abstract
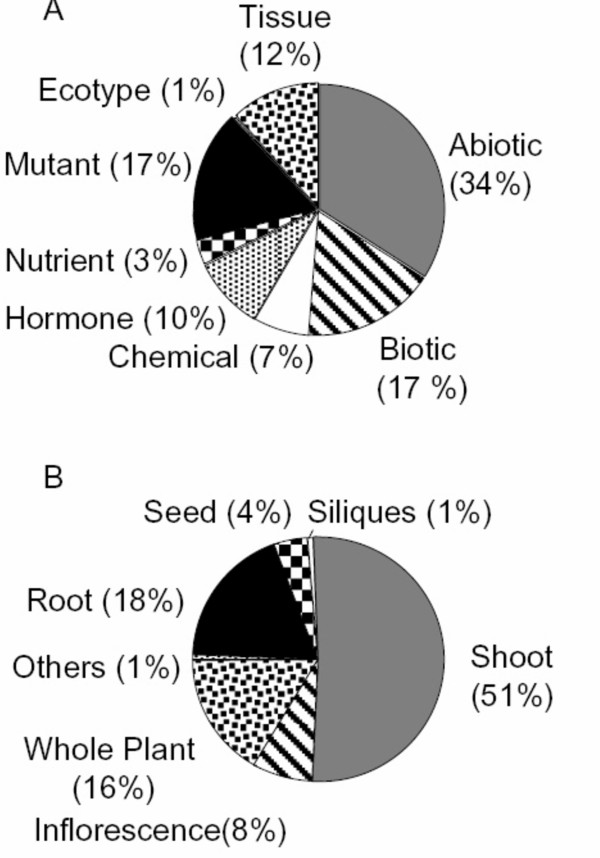
Background: Microarray technology is a widely used approach for monitoring genome-wide gene expression. For Arabidopsis, there are over 1,800 microarray hybridizations representing many different experimental conditions on Affymetrix ATH1 gene chips alone. This huge amount of data offers a unique opportunity to infer the principles that govern the regulation of gene expression in plants.
Results: We used bioinformatics methods to analyze publicly available data obtained using the ATH1 chip from Affymetrix. A total of 1887 ATH1 hybridizations were normalized and filtered to eliminate low-quality hybridizations. We classified and compared control and treatment hybridizations and determined differential gene expression. The largest differences in gene expression were observed when comparing samples obtained from different organs. On average, ten-fold more genes were differentially expressed between organs as compared to any other experimental variable. We defined "gene responsiveness" as the number of comparisons in which a gene changed its expression significantly. We defined genes with the highest and lowest responsiveness levels as hypervariable and housekeeping genes, respectively. Remarkably, housekeeping genes were best distinguished from hypervariable genes by differences in methylation status in their transcribed regions. Moreover, methylation in the transcribed region was inversely correlated (R2 = 0.8) with gene responsiveness on a genome-wide scale. We provide an example of this negative relationship using genes encoding TCA cycle enzymes, by contrasting their regulatory responsiveness to nitrate and methylation status in their transcribed regions.
Conclusion: Our results indicate that the Arabidopsis transcriptome is largely established during development and is comparatively stable when faced with external perturbations. We suggest a novel functional role for DNA methylation in the transcribed region as a key determinant capable of restraining the capacity of a gene to respond to internal/external cues. Our findings suggest a prominent role for epigenetic mechanisms in the regulation of gene expression in plants.
Figures


References
-
- Kilian J, Whitehead D, Horak J, Wanke D, Weinl S, Batistic O, D'Angelo C, Bornberg-Bauer E, Kudla J, Harter K. The AtGenExpress global stress expression data set: protocols, evaluation and model data analysis of UV-B light, drought and cold stress responses. Plant J. 2007;50:347–363. doi: 10.1111/j.1365-313X.2007.03052.x. - DOI - PubMed
-
- Hughes TR, Marton MJ, Jones AR, Roberts CJ, Stoughton R, Armour CD, Bennett HA, Coffey E, Dai H, He YD, Kidd MJ, King AM, Meyer MR, Slade D, Lum PY, Stepaniants SB, Shoemaker DD, Gachotte D, Chakraburtty K, Simon J, Bard M, Friend SH. Functional discovery via a compendium of expression profiles. Cell. 2000;102:109–126. doi: 10.1016/S0092-8674(00)00015-5. - DOI - PubMed
Publication types
MeSH terms
Substances
LinkOut - more resources
Full Text Sources
Other Literature Sources
Molecular Biology Databases
