

Impact of different leaf velocities and dose rates on the number of monitor units and the dose-volume-histograms using intensity modulated radiotherapy with sliding-window technique
- PMID: 18811954
- PMCID: PMC2561032
- DOI: 10.1186/1748-717X-3-31
Impact of different leaf velocities and dose rates on the number of monitor units and the dose-volume-histograms using intensity modulated radiotherapy with sliding-window technique
Abstract
Background: Intensity modulated radiotherapy (IMRT) using sliding window technique utilises a leaf sequencing algorithm, which takes some control system limitations like dose rates (DR) and velocity of the leafs (LV) into account. The effect of altering these limitations on the number of monitor units and radiation dose to the organs at risk (OAR) were analysed.
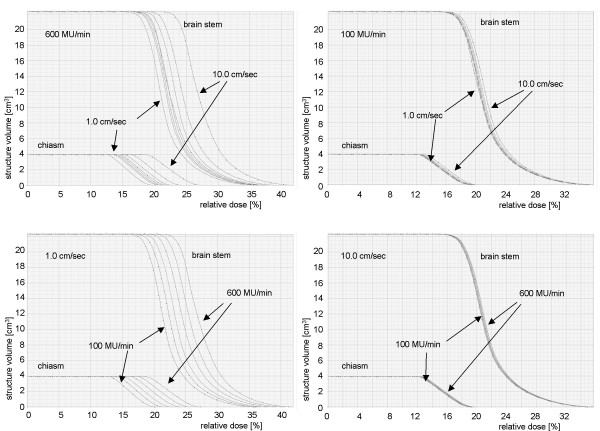
Methods: IMRT plans for different LVs from 1.0 cm/sec to 10.0 cm/sec and different DRs from 100 MU/min to 600 MU/min for two patients with prostate cancer and two patients with squamous cell cancer of the scalp (SCCscalp) were calculated using the same "optimal fluence map". For each field the number of monitor units, the dose volume histograms and the differences in the "actual fluence maps" of the fields were analysed.
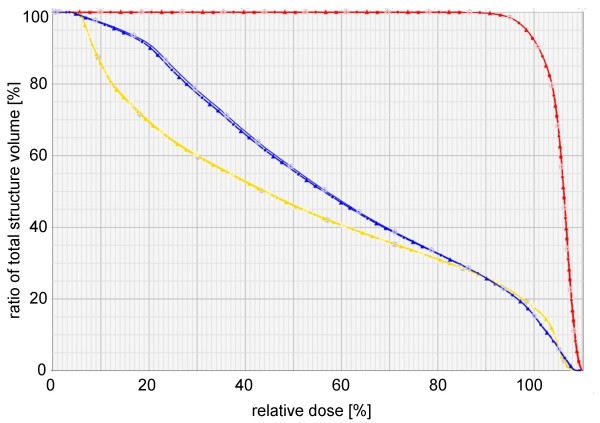
Results: With increase of the DR and decrease of the LV the number of monitor units increased and consequentially the radiation dose given to the OAR. In particular the serial OARs of patients with SCCscalp, which are located outside the end position of the leafs and inside the open field, received an additional dose of a higher DR and lower LV is used.
Conclusion: For best protection of organs at risk, a low DR and high LV should be applied. But the consequence of a low DR is both a long treatment time and also that a LV of higher than 3.0 cm/sec is mechanically not applicable. Our recommendation for an optimisation of the discussed parameters is a leaf velocity of 2.5 cm/sec and a dose rate of 300-400 MU/min (prostate cancer) and 100-200 MU/min (SCCscalp) for best protection of organs at risk, short treatment time and number of monitor units.
Figures


Similar articles
-
Pre-segmented 2-Step IMRT with subsequent direct machine parameter optimisation - a planning study.Radiat Oncol. 2008 Nov 6;3:38. doi: 10.1186/1748-717X-3-38. Radiat Oncol. 2008. PMID: 18990227 Free PMC article.
-
Dynamic MLC leaf sequencing for integrated linear accelerator control systems.Med Phys. 2011 Nov;38(11):6039-45. doi: 10.1118/1.3651628. Med Phys. 2011. PMID: 22047368
-
Treatment plan comparison between helical tomotherapy and MLC-based IMRT using radiobiological measures.Phys Med Biol. 2007 Jul 7;52(13):3817-36. doi: 10.1088/0031-9155/52/13/011. Epub 2007 May 31. Phys Med Biol. 2007. PMID: 17664579
-
Artificial Intelligence in Radiation Oncology.Hematol Oncol Clin North Am. 2019 Dec;33(6):1095-1104. doi: 10.1016/j.hoc.2019.08.003. Epub 2019 Sep 11. Hematol Oncol Clin North Am. 2019. PMID: 31668208 Review.
-
Intensity-modulated radiation therapy.Radiat Res. 2002 Jul;158(1):115-7. doi: 10.1667/0033-7587(2002)158[0115:imrt]2.0.co;2. Radiat Res. 2002. PMID: 12071811 Review.
Cited by
-
Beam rate influence on dose distribution and fluence map in IMRT dynamic technique.Rep Pract Oncol Radiother. 2012 Feb 10;17(2):97-103. doi: 10.1016/j.rpor.2012.01.004. eCollection 2012. Rep Pract Oncol Radiother. 2012. PMID: 24377007 Free PMC article.
-
Capability of leaf interdigitation with different inverse planning strategies in Monaco: an investigation of representative tumour sites.Radiat Oncol. 2016 Jun 17;11:82. doi: 10.1186/s13014-016-0655-1. Radiat Oncol. 2016. PMID: 27316707 Free PMC article.
-
Development and performance evaluation of a high-speed multileaf collimator.J Appl Clin Med Phys. 2017 Jan;18(1):96-106. doi: 10.1002/acm2.12026. Epub 2016 Dec 29. J Appl Clin Med Phys. 2017. PMID: 28291930 Free PMC article.
-
Practical implications for the quality assurance of modulated radiation therapy techniques using point detector arrays.J Appl Clin Med Phys. 2017 Nov;18(6):20-31. doi: 10.1002/acm2.12157. Epub 2017 Aug 30. J Appl Clin Med Phys. 2017. PMID: 28857409 Free PMC article.
-
Single arc volumetric-modulated arc therapy is sufficient for nasopharyngeal carcinoma: a dosimetric comparison with dual arc VMAT and dynamic MLC and step-and-shoot intensity-modulated radiotherapy.Radiat Oncol. 2013 Oct 14;8:237. doi: 10.1186/1748-717X-8-237. Radiat Oncol. 2013. PMID: 24125432 Free PMC article.
References
-
- Emami B, Lyman J, Brown A, Coia L, Goitein M, Munzenrider JE, Shank B, Solin LJ, Wesson M. Tolerance of normal tissue to therapeutic irradiation. Int J Radiat Oncol Biol Phys. 1991;21:109–122. - PubMed
-
- De Martin E, Fiorino C, Broggi S, Longobardi B, Pierelli A, Perna L, Cattaneo GM, Calandrino R. Agreement criteria between expected and measured field fluences in IMRT of head and neck cancer: The importance and use of the gamma histograms statistical analysis. Radiother Oncol. 2007;85:399–406. doi: 10.1016/j.radonc.2007.10.045. - DOI - PubMed
MeSH terms
LinkOut - more resources
Full Text Sources
Research Materials
